
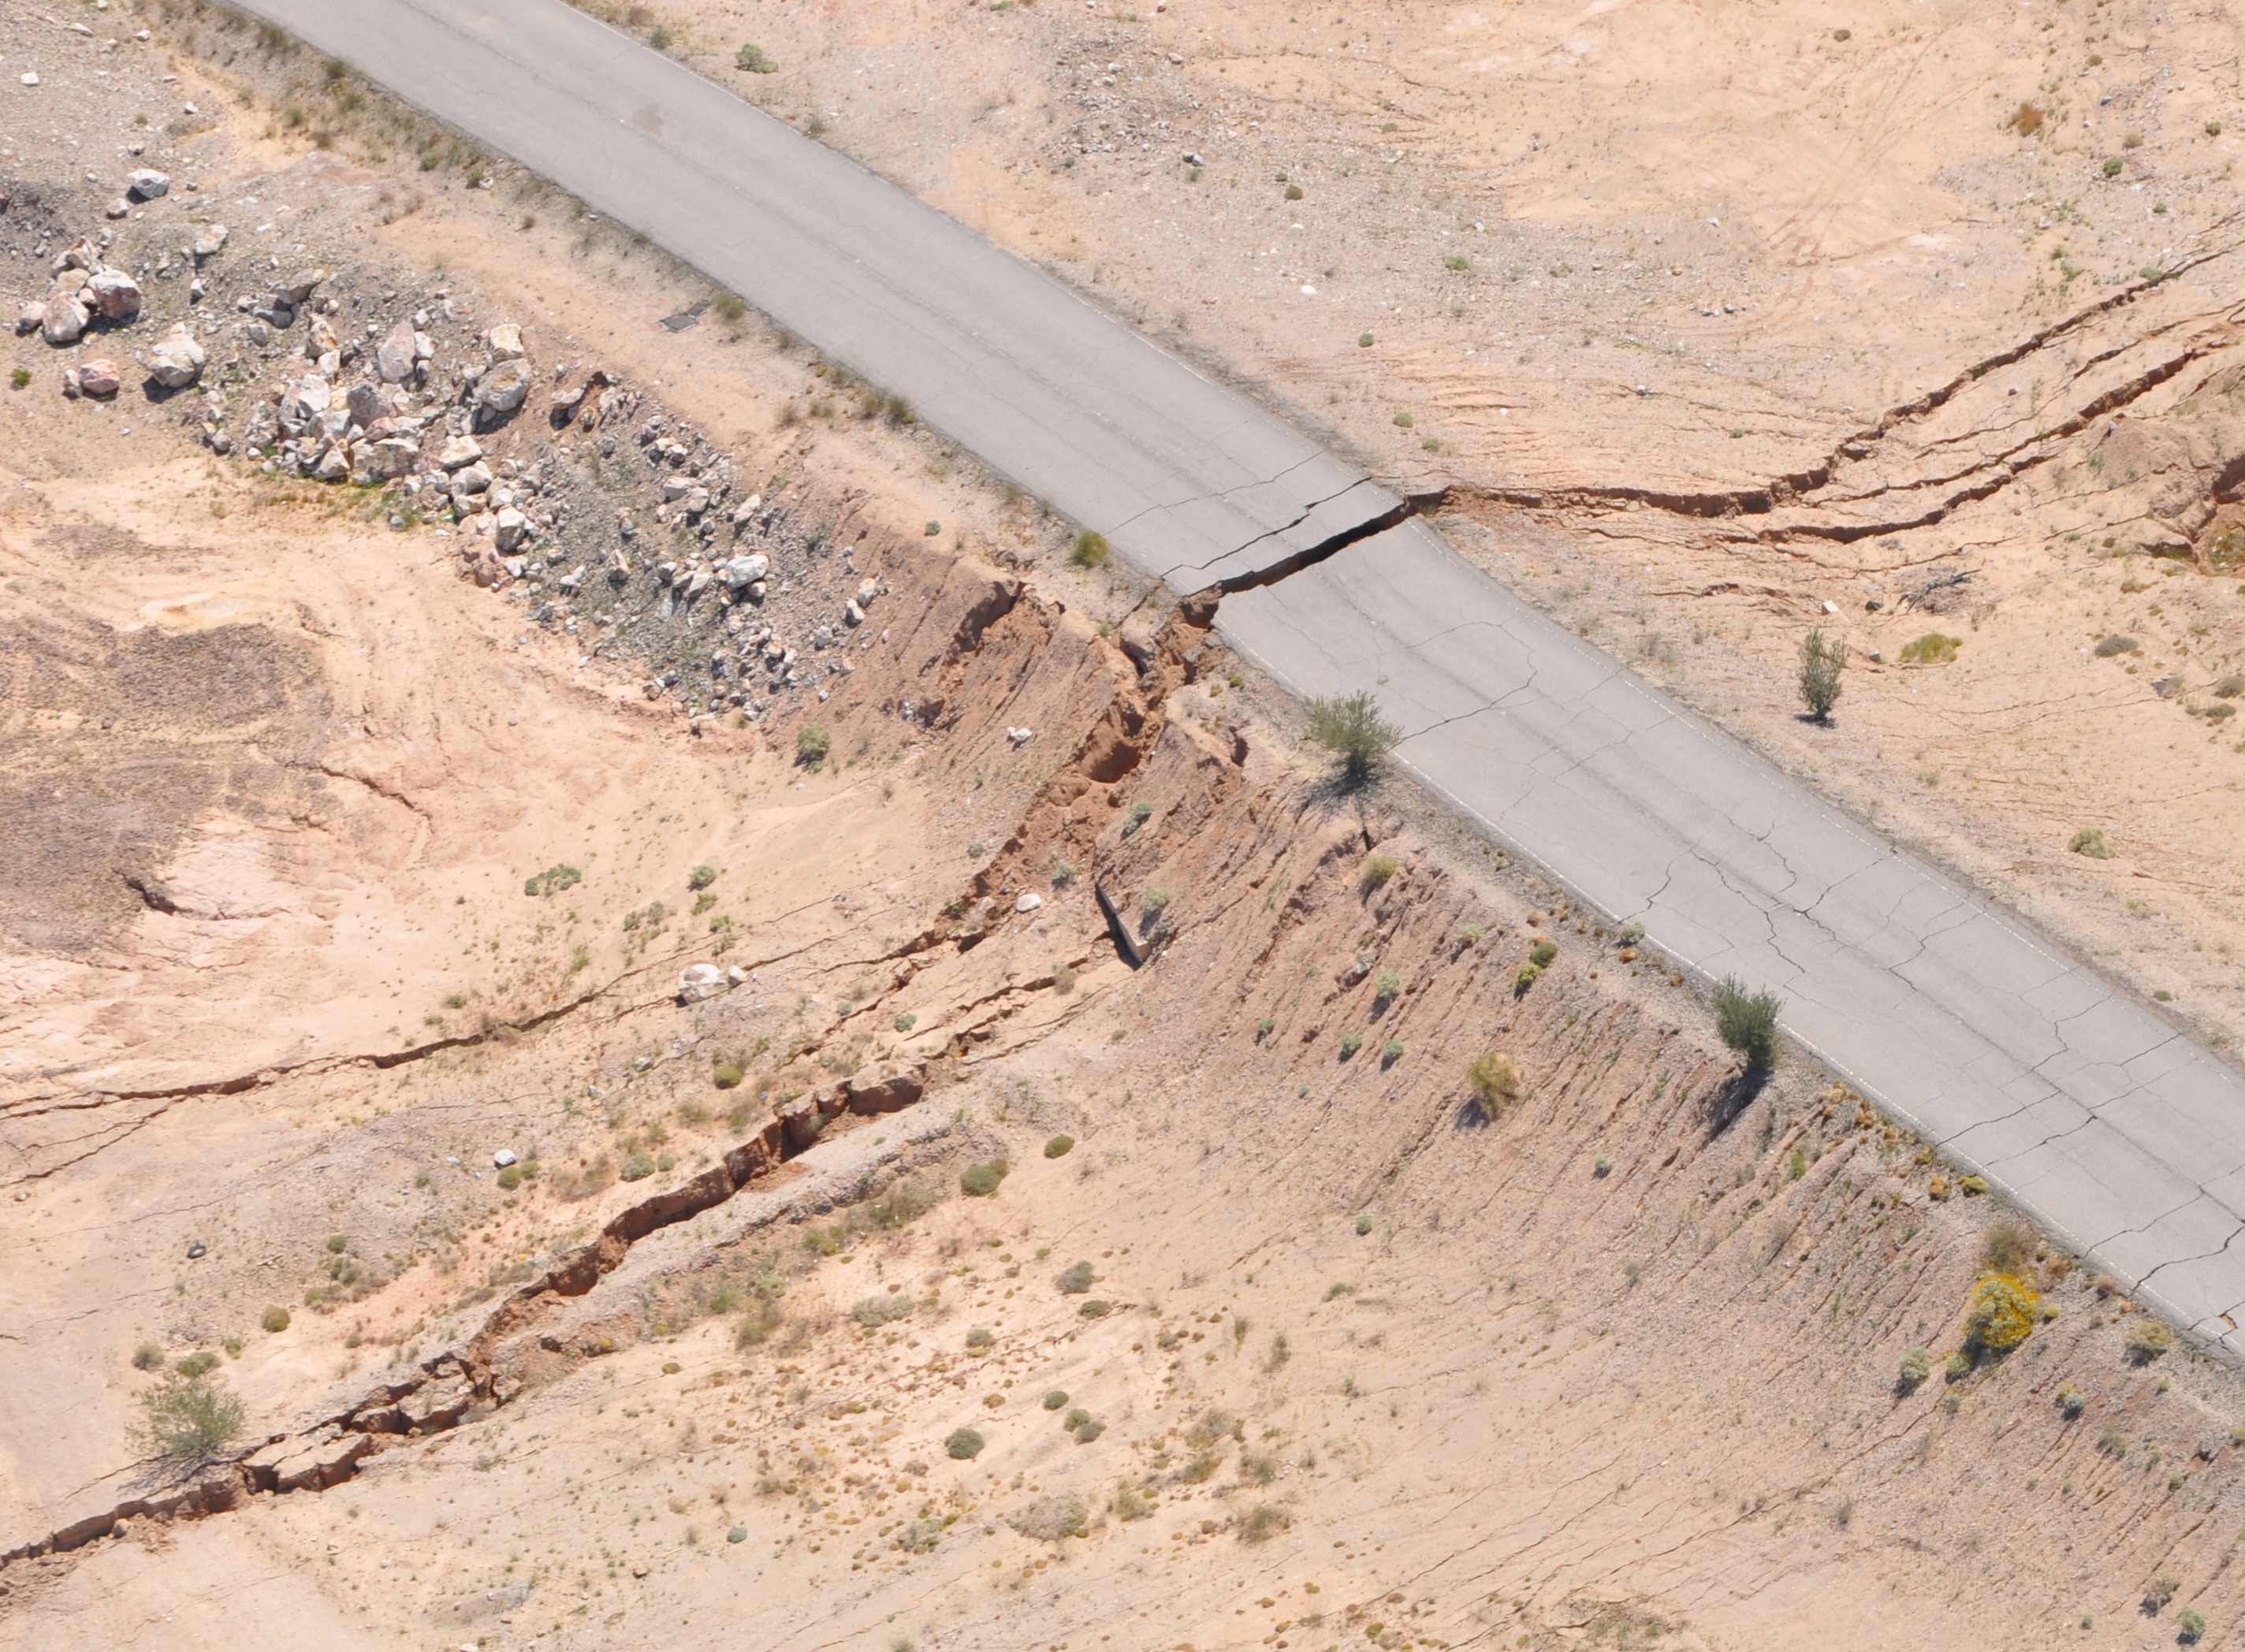
Part of the surface rupture from the magnitude 7.2 El Mayor–Cucapah earthquake where it crossed a road, as seen from a helicopter shortly after the event. (USGS photo by Ken Hudnut)
—by Beth Bartel
EarthScope Plate Boundary Observatory (PBO) stations all throughout the western U.S. are poised to record earthquakes, but not all of them have had the opportunity yet. Unlike the seismometers of the USArray, which can record tiny tremors in the earth, GPS/GNSS (Global Navigation Satellite System) instruments like P496 require a fairly big earthquake to get them moving—usually at least a magnitude 5 that occurs shallower than about 15 km (10 miles) depth.
On April 4, 2010, a magnitude 7.2 earthquake ruptured through the desert of northwestern Mexico and southern California. Later named the El Mayor–Cucapah earthquake, it not only shook PBO station P496, but moved the station permanently.
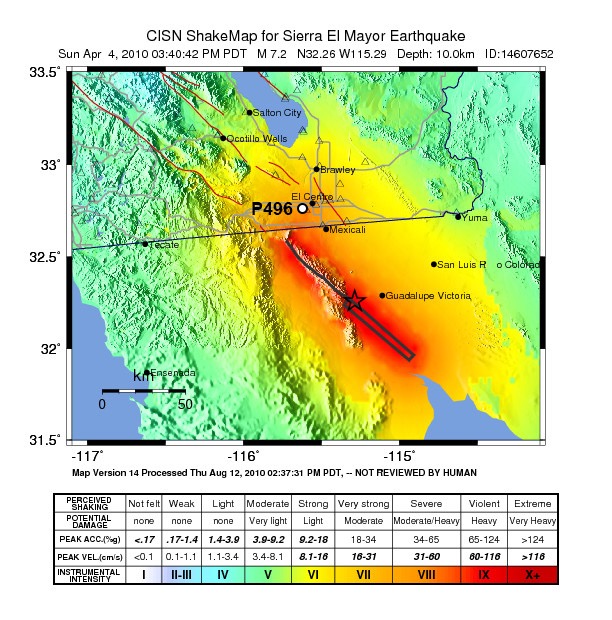
Above: Approximate location of station P496 (white circle) relative to the El Mayor–Cucapah earthquake rupture area (thick black lines). The star is the location of the quake’s epicenter, where the rupture initiated. (Figure modified from the Southern California Seismic Network)
Even though this station is more than 60 km (37 miles) from the earthquake’s origin and 15 km (about 10 miles) from the northern extent of the earthquake’s rupture, it lurched violently by more than 18 cm, or a little over 7 inches. (The station offset estimates were 22 mm eastward, 183 mm southward, and 9 mm upward.) Since then, P496 has continued to move at a steady rate faster than before the quake.
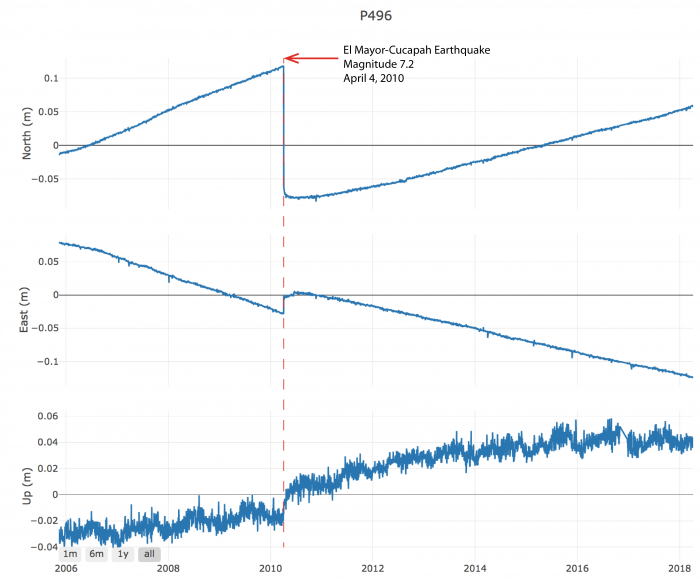
Above: Change in position over time for station P496 in southern California. The station moved rapidly east, south, and up as a result of the El Mayor–Cucapah earthquake on April 4, 2010. (Figure by UNAVCO)
The movement of PBO site P496 on its own at the time of the El Mayor–Cucapah earthquake would not be enough to teach us much about the earthquake. Combining information from P496 with many other GPS stations, plus the fault rupture data, seismological network data, and satellite imagery, however, creates a more complete picture of how the earthquake progressed (abstract, full paper). This study showed that while the earthquake looked like a simple break along a straight line from above the ground, at depth the earthquake was far more complex. It started out small, and became big as the rupture jumped from one fault section to the next in a cascading rupture process.
P496 moved again, but only by a little bit, during the 2012 Brawley Earthquake Swarm. This swarm included hundreds of small- and medium-sized earthquakes. The slow, long-term movement between the earthquakes, as well as the sudden movements during earthquakes and the adjustment after each earthquake, all tell us more about how faults and earthquakes work.
About 570 earthquakes greater than magnitude 5 have occurred within the PBO footprint since the network’s installation, though not all of them were shallow enough or close enough to stations to be recorded. More than three-quarters of these earthquakes (about 80%) occurred in Alaska, including five out of the eight magnitude 7+ earthquakes. We will continue to learn about earthquakes through the Plate Boundary Observatory’s motion recordings leading up to, during, and after these jarring events.
Additional Resources
Read more about P496 and the El Mayor Cucapah earthquake.
Earthquake-related offsets of PBO GPS stations for all events affecting the network.
In addition to event-specific offsets, the GAGE GPS Analysis Center Coordinator also generates a master list of all PBO GPS time series offsets, from earthquakes as well as other causes, in a single file.


