
Visualizing Current Earthquake Events
Current earthquakes are effective teachable moments, even months after one happens. Teams of scientists and communicators, including graphic designers, are able to produce in a timely manner effective explanations and engaging visuals that are picked up by the media and help communicate the complexity of an earthquake. Using this visual information can help students better understand a specific event, and be an engaging tool in discussing broader societal impacts and emerging technology such as early warning systems.
Example: 2018 Alaska 7.9 Earthquake
At 12:31 am on January 23, a magnitude 7.9 earthquake struck in the Gulf of Alaska about 180 miles southeast of Kodiak Island. It was the second time in three years that an early morning January earthquake woke Alaskans across the state.
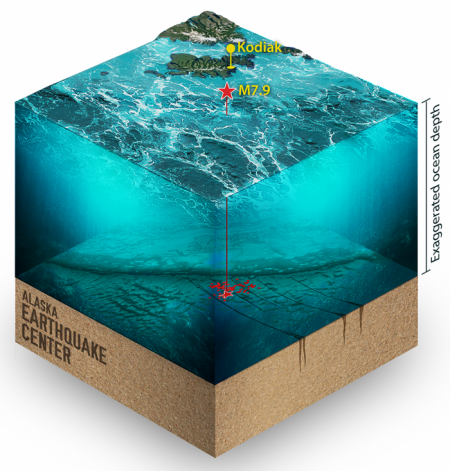 Event Overview from Alaska Earthquake Center
IRIS Teachable moment: 12-slide Powerpoint presentation/animation (zipped ppt 13.8 MB / pdf 1.07 MB
US Geological Survey 7.9 Earthquake 280 km Southeast of Kodiak, Alaska Interactive maps of the earthquake.
Suggested follow-up discussion:
What makes for an effective earthquake early warning system? In this animation[.mp4], we see why Japan's earthquake early warning system underestimated the magnitude of the March 11, 2011 Tōhoku event, leading to underestimates of the tsunami. The animation illustrates how, by using GPS data, we could more effectively detect and describe a similar great earthquake along the Cascadia subduction zone in the Pacific Northwest.
What Would an Earthquake Sound Like?
An audio representation of seismic waves
Science is informed by all the senses, not just sight. The Seismic Sound Lab (www.seismicsoundlab.org) develops sonic and visual representations of natural data. Among the lab’s creations is an audio-visual representation of seismic wave motion, so students can “hear” earthquakes. The Seismic Sound Lab, located at the Lamont Doherty Earth Observatory, produces the SeismoDome show at the Hayden Planetarium at the American Museum of Natural History.
Examples of Learning Units Available for Teachers
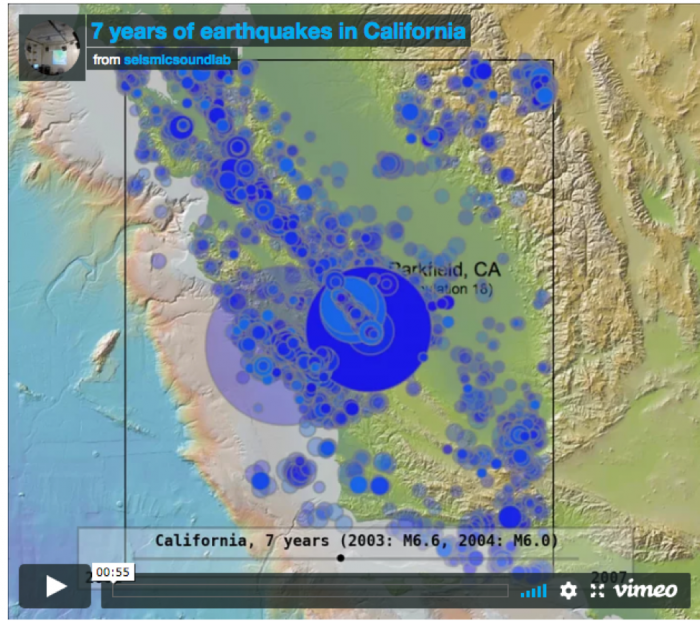
Regional Seismicity Patterns: Visual and audio movies showing earthquake clusters in several regions. Includes a key of how the engineered sounds match up with earthquake magnitude and depth.
 Wave Propagation in the Earth: This includes several different earthquake visualizations, both with and without audio. (The second movie features the Transportable Array, based on the approach by Chuck Ammon at Pennsylvania State University and the group at IRIS.) Explore what the Seismic Sound Lab has to offer! More movies are available at vimeo.com/seismicsoundlab.
Much of this work was developed under funding from NSF EarthScope grant EAR 11-47763.
Visualizing Earthquakes with Lasers
Scientists visualize earthquakes in a variety of ways. In this issue’s feature article “EarthScope's Laser Vision: Sharing Lidar Data,” learn how a detailed example of using laser-generated, high-resolution images enhances students’ ability to detect and understand earthquake traces in landscapes.
Random Earthquake Visualization Fun
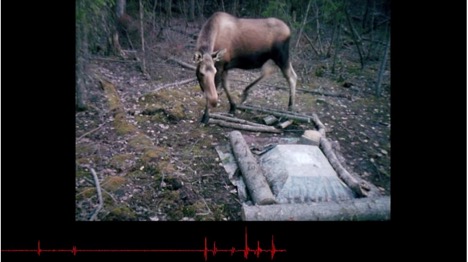
Seismograms record anything that makes the ground shake. In these videos, seismograph records pick up the wandering of nearby wildlife:
Elk running near seismic station
"Earthquake moose" footsteps in Alaska
What is Your EarthScope Visualization? Share your science with a broader audience by participating to 2018 EarthScope Visualization Challenge. Find all the info online.


