
By Gail McCormick - April 2017
The ice groans as a chunk splinters from its side, scrapes down the glacier’s edge, and tumbles into the sea. Water surges upwards with a great splash. And then, the glacier shudders.
In an event known as glacial calving, seismic waves travel through the glacier and can be detected more than 100 kilometers (60 miles) away. Glaciologists and, surprisingly, seismologists, are studying these icequakes—the vibrations triggered by the breaking up of ice—to determine why and when calving takes place at glaciers that end in the ocean.
"What makes a glacier calve seems like a simple question, but the process is really poorly understood."
"What makes a glacier calve seems like a simple question, but the process is really poorly understood," says Timothy Bartholomaus, Assistant Professor of Geological Sciences at the University of Idaho. Finding the answer has become increasingly important given the alarming rate of glacial retreat in past decades. Glaciers lose about 260 billion tons of ice each year, contributing to about a third of sea level rise, but how much of this happens during calving events is still unclear. A single calving event can send a massive chunk 60 meters wide by 30 meters tall (600 x 200 feet) careening into the ocean.
The rate of glacial ice loss can change abruptly and unpredictably, and Bartholomaus wanted to know why. “If we want to have good predictions of what the sea level is going to do in the next decade to hundred years to two hundred years,” he says, “we need to better understand what controls calving rates of tidewater glaciers.”
Tidewater glaciers—glaciers that end in the ocean—are some of the fastest-changing glaciers on Earth. “They are losing mass most quickly, thinning most quickly, and retreating most quickly,” says Bartholomaus.
To better understand why glaciers calve, seismologists are examining seismic signals produced by icequakes. The recent transition of the Transportable Array to southern Alaska may help further our understanding of icequakes and their connection to ice loss and sea level rise.
Bartholomaus and colleagues from the University of Alaska Fairbanks and the USGS Alaska Science Center focused on Yahtse Glacier in Icy Bay, Alaska, where calving events occur nearly once per minute–several times more often than at other glaciers studied in Alaska. The team first wanted to know when calving was happening at the edge of the glacier so that he could match the seismic waves to the size of the fallen ice chunk. Then they considered environmental factors including rainfall, wind, and temperatures, that might correspond to times when the glacier crumbled most.
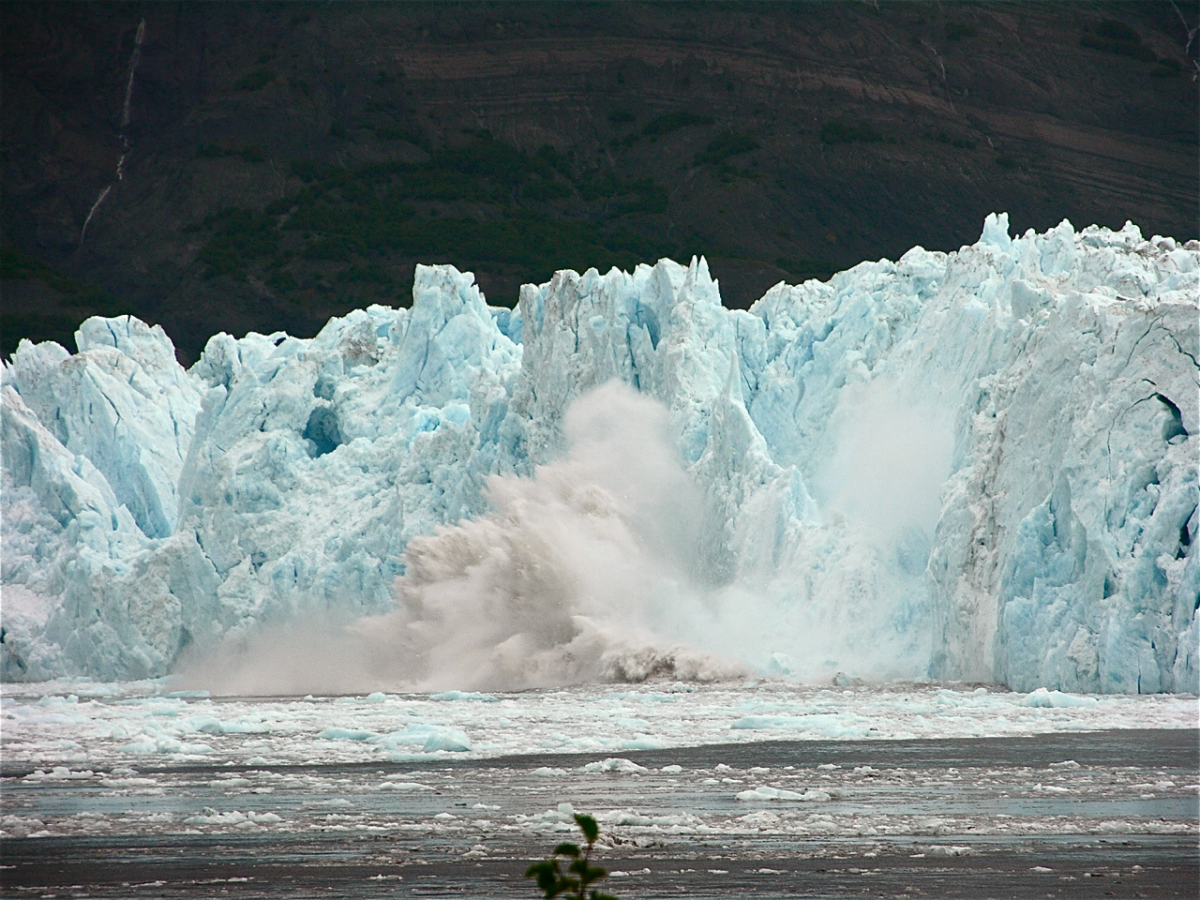
Photo: A calving event at Yahtse Glacier in Icy Bay, Alaska, sends a seismic wave through the ice. Seismologists are using these seismic signals to determine when and why calving occurs (Photo by Tim Bartholomaus).
Using Seismology at Glaciers
Documenting calving events can be difficult without physically being there to watch blocks fall off the glacier’s edge, or terminus. While the team did visit the glacier, they primarily turned to records of seismicity generated by the ice shaking during icequakes.
“With seismology we can get the second-to-second resolution of what’s going on at the glacier terminus, we can in essence capture and study every single calving event that occurs.”
“With seismology we can get the second-to-second resolution of what’s going on at the glacier terminus,” says Bartholomaus. “We can in essence capture and study every single calving event that occurs.” When large blocks of ice tear off the glacier’s edge and fall into the ocean, they make a big initial splash. Water engulfs the block, creating an air pocket above it. “When that air cavity closes, it slaps shut and sends up a jet of water,” explains Bartholomaus. “And it’s that slapping shut of an air cavity that produces the strongest seismic signals.”
The seismic waves from icequakes have a signature distinct from those from earthquakes. Local magnitudes are typically near 1.0, and they lack distinct arrivals of P- and S- waves. They are mostly surface waves that seem to travel through the ice, over the surface, and through shallow crust, and are detected by recording stations hundreds of kilometers away.
Bartholomaus and his team set up nine IRIS PASSCAL seismometers at the terminus of Yahtse glacier to record seismic activity from 2009 to 2011. They could readily detect the frequency of calving events, but the team was interested in more than just when icequakes occur.
Ultimately, Bartholomaus and his colleagues wanted to know just how much ice is lost in a particular time period—they needed a way to use the icequake data to estimate the size of the ice block that falls into the water. They started out the old-fashioned way, traveling to Icy Bay and watching, in person, thousands of calving events at Yahtse Glacier over 12 days in June 2010. They noted each instance of falling ice and matched it with the records from the seismometers.
For each event, they visually estimated the iceberg size by lumping it into one of seven size classes, which ranged from chunks smaller than 30 feet on one side to 600 foot-wide sheets that spanned the entire height of the glacier, at almost 200 feet. They also recorded the type of calving event, such as large free-falling slabs, loose avalanches, or small blocks beneath the water surface gently separating from the submarine terminus and floating to the surface. The team then created a model based on their observations to correlate iceberg size, or the amount of ice lost in each event, with the icequake seismic data. They initially included a wide variety of seismic characteristics, but it turned out that the best indicators of iceberg size were how long the shaking lasts and the type of calving event that took place. The amplitude of the seismic wave—roughly the strength of the icequake—was also a good predictor, but not as useful as duration.
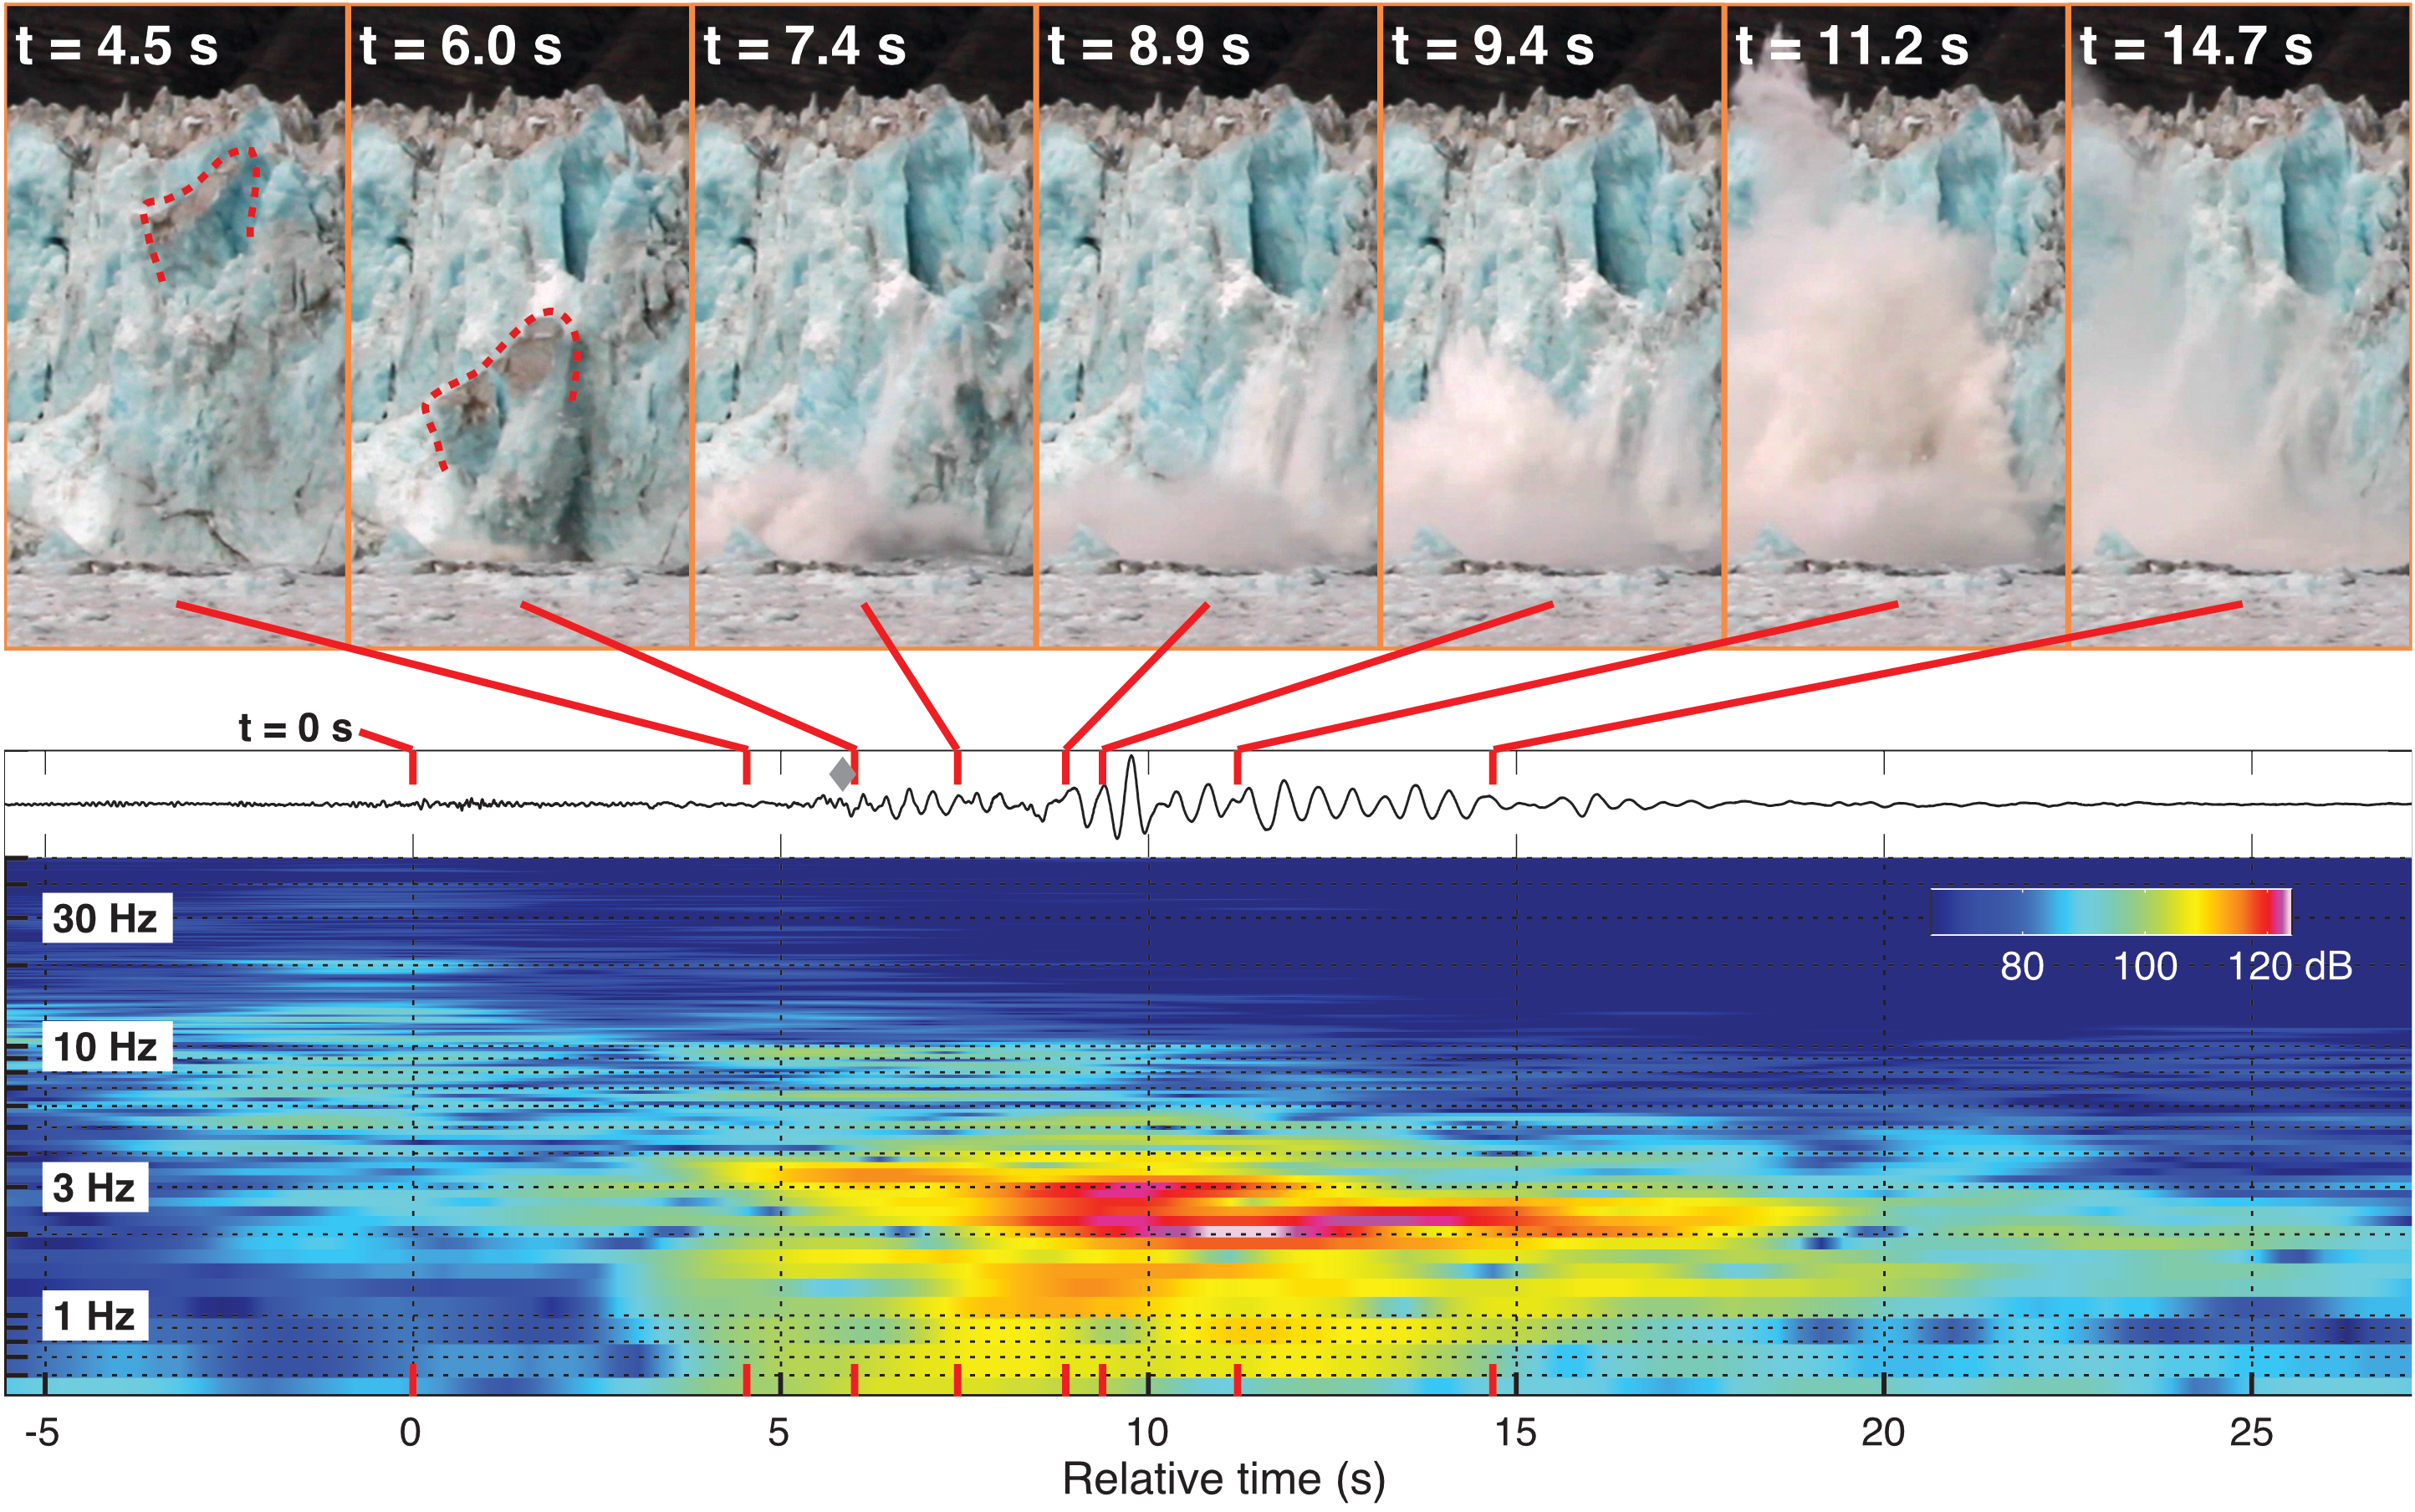
Seismic data is paired to photo stills from a calving event, demonstrating how interactions between icebergs and the sea surface produce icequakes. From Bartholomaus et al., 2012, used with permission.
Calving Season
Bartholomaus and his team didn’t stop at predicting the size of a calving block from its seismic signal. They wanted to pinpoint why Yahtse Glacier was crumbling so frequently. Using their new, calibrated model for the rest of the seismic data that they collected from the PASSCAL instruments on the glacier—several hundreds of thousands of icequake events from 2009 to 2011, they noted when the biggest events occurred, and then considered weather and other environmental variables at those times. Factors included daily rainfall, wind speeds, and temperature, as well as tide and season. The team published their results in the November 2015 issue of Journal of Geophysical Research and their data through the IRIS Data Management Center (network XF, YAHTSE).
Not surprisingly, calving occurred less frequently at Yahtse Glacier during the winter, when ice advances. The summer is a different story, sometimes with more than 800 calving icequakes per day. And it turns out that most of the summer ice loss may be due to action under the water, where ice is prone to erosion from the influx of warm summer water. “We can see 60 meters (200 feet) of glacier terminus above the water line,” notes Bartholomaus, “but Yahtse extends for 100 or 120 meters below the waterline, and many glaciers in Greenland and Antarctica extend for a kilometer or more. Most of the action is hidden from us.”
Supporting the team’s suspicion of underwater influences, the biggest calving events tended to happen during falling and low tides. The deeper water during high tides may have a stabilizing effect. Additionally, calving rates were not strongly related to forces that primarily act on the glacier's surface, including rainfall, temperature, and wind speed.
Understanding why glaciers calve helps shape our understanding of how glaciers will retreat in the future and how sea level will rise as ice continues to melt into the oceans. Bartholomaus hopes to improve his model, for example by tracking iceberg sizes and icequakes in different seasons. “Because glaciers are advancing and retreating seasonally,” explains Bartholomaus, “the terminus is at a different spot on the seafloor and may be in deeper or shallower water.” These factors may affect the seismic signal of the resulting icequake.
The team also hopes to test the model at other glaciers. “Some of this work is already taking place, and other researchers are finding corroborating evidence,” notes Bartholomaus. Glacier studies in Norway and other parts of Alaska also found that icequake duration could be used to predict iceberg size.
“The Transportable Array gives us this chance to address the same kind of questions, but much more broadly across all of the 40 or so glaciers that calve in Alaska."
And Bartholomaus may see his next opportunity to study icequakes in greater detail using the Transportable Array. “The Transportable Array gives us this chance to address the same kind of questions,” says Bartholomaus, “but much more broadly across all of the 40 or so glaciers that calve in Alaska.”
In addition to Bartholomaus, the research team included Chris Larsen and Michael West of University of Alaska Fairbanks, and Shad O’Neel of the U.S. Geological Survey Alaska Science Center.
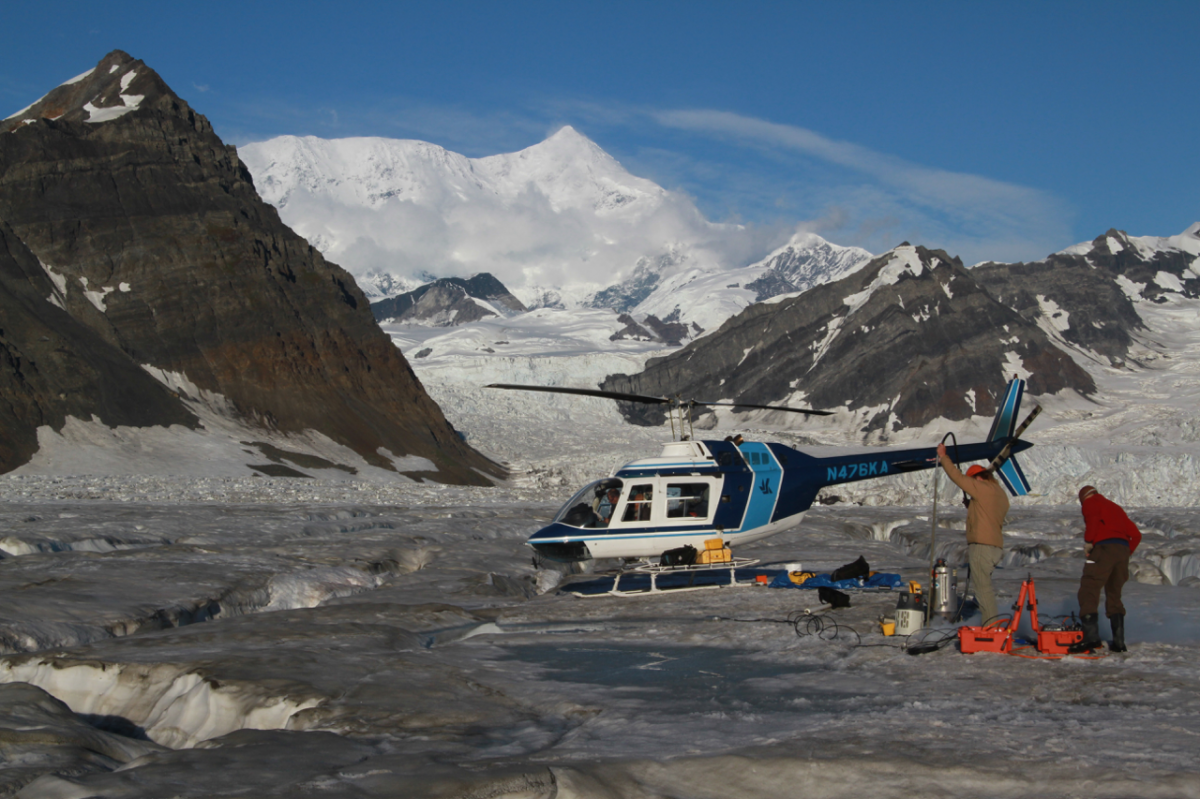
A team of researchers from University of Alaska Fairbanks maintain GPS and seismic equipment to record ice motion and icequakes at Yahtse Glacier, Alaska. Photo by Tim Bartholomaus
Top image: A calving event at Yahtse Glacier in Icy Bay, Alaska, sends seismic waves through the ice. Seismologists are using these seismic signals to determine when and why calving occurs. Photo by Tim Bartholomaus.
NSF-related Funding Sources: NSF EAR-0810313
EarthScope Affiliations: UNAVCO and IRIS PASSCAL provided instruments, IRIS stored data/made data accessible. IRIS focus to ending (TA in Alaska)


