

By Corne Kreemer - Spring 2013
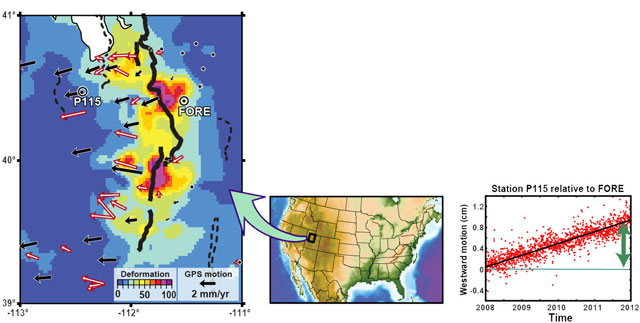
EarthScope’s PBO not only benchmarks deformation along plate boundaries, but shows differential motion across faults within the North American Plate. The map on the left shows the movement of GPS sites on either side of the north-south Wasatch Fault system (thick black lines) in central Utah. Black arrows are motions at PBO sites, red arrows at other campaign sites. Sites to the west of the fault system display westward motion (~2-4 mm), while sites to the east show very little movement (circles and small arrows). This differential motion results in deformation (strain) localized along the Wasatch (warm color shading), but not on other faults (dashed lines). This accumulating strain is highlighted by the westward motion of Station P115 relative to Station Fore over time (right panel): in just four years up to 9 mm of relative motion has occurred, and results in the plotted strain on the map. This work illustrates how deformation often occurs well off tectonic plate boundaries, while likely associated with processes related to plate motion.


