To meet EarthScope's scientific goals, a variety of geophysical instrumentation has been installed across the country. The freely available, high precision data allow scientists to describe how geological forces shaped North America's landscape and contribute to the public's understanding of our dynamic Earth. Scientists use EarthScope data to explore new features inside the earth that could not be seen before, and to test specific ideas about how the earth works. EarthScope Facilities develop, install and maintain the instruments; acquires, delivers, and archives the data; and develops tools for scientists and the public to visualize the data.
An array of portable seismometers
![]()
The USArray is one EarthScope facility, operated by a non-profit university consortium for seismology called IRIS. The USArray consists of seismometers and magnetotelluric devices that are temporarily deployed across the U.S.
Listen to this great interview to answer most of the questions you might have about this adventure: "An instrument at every Starbucks" (3.3.2017)
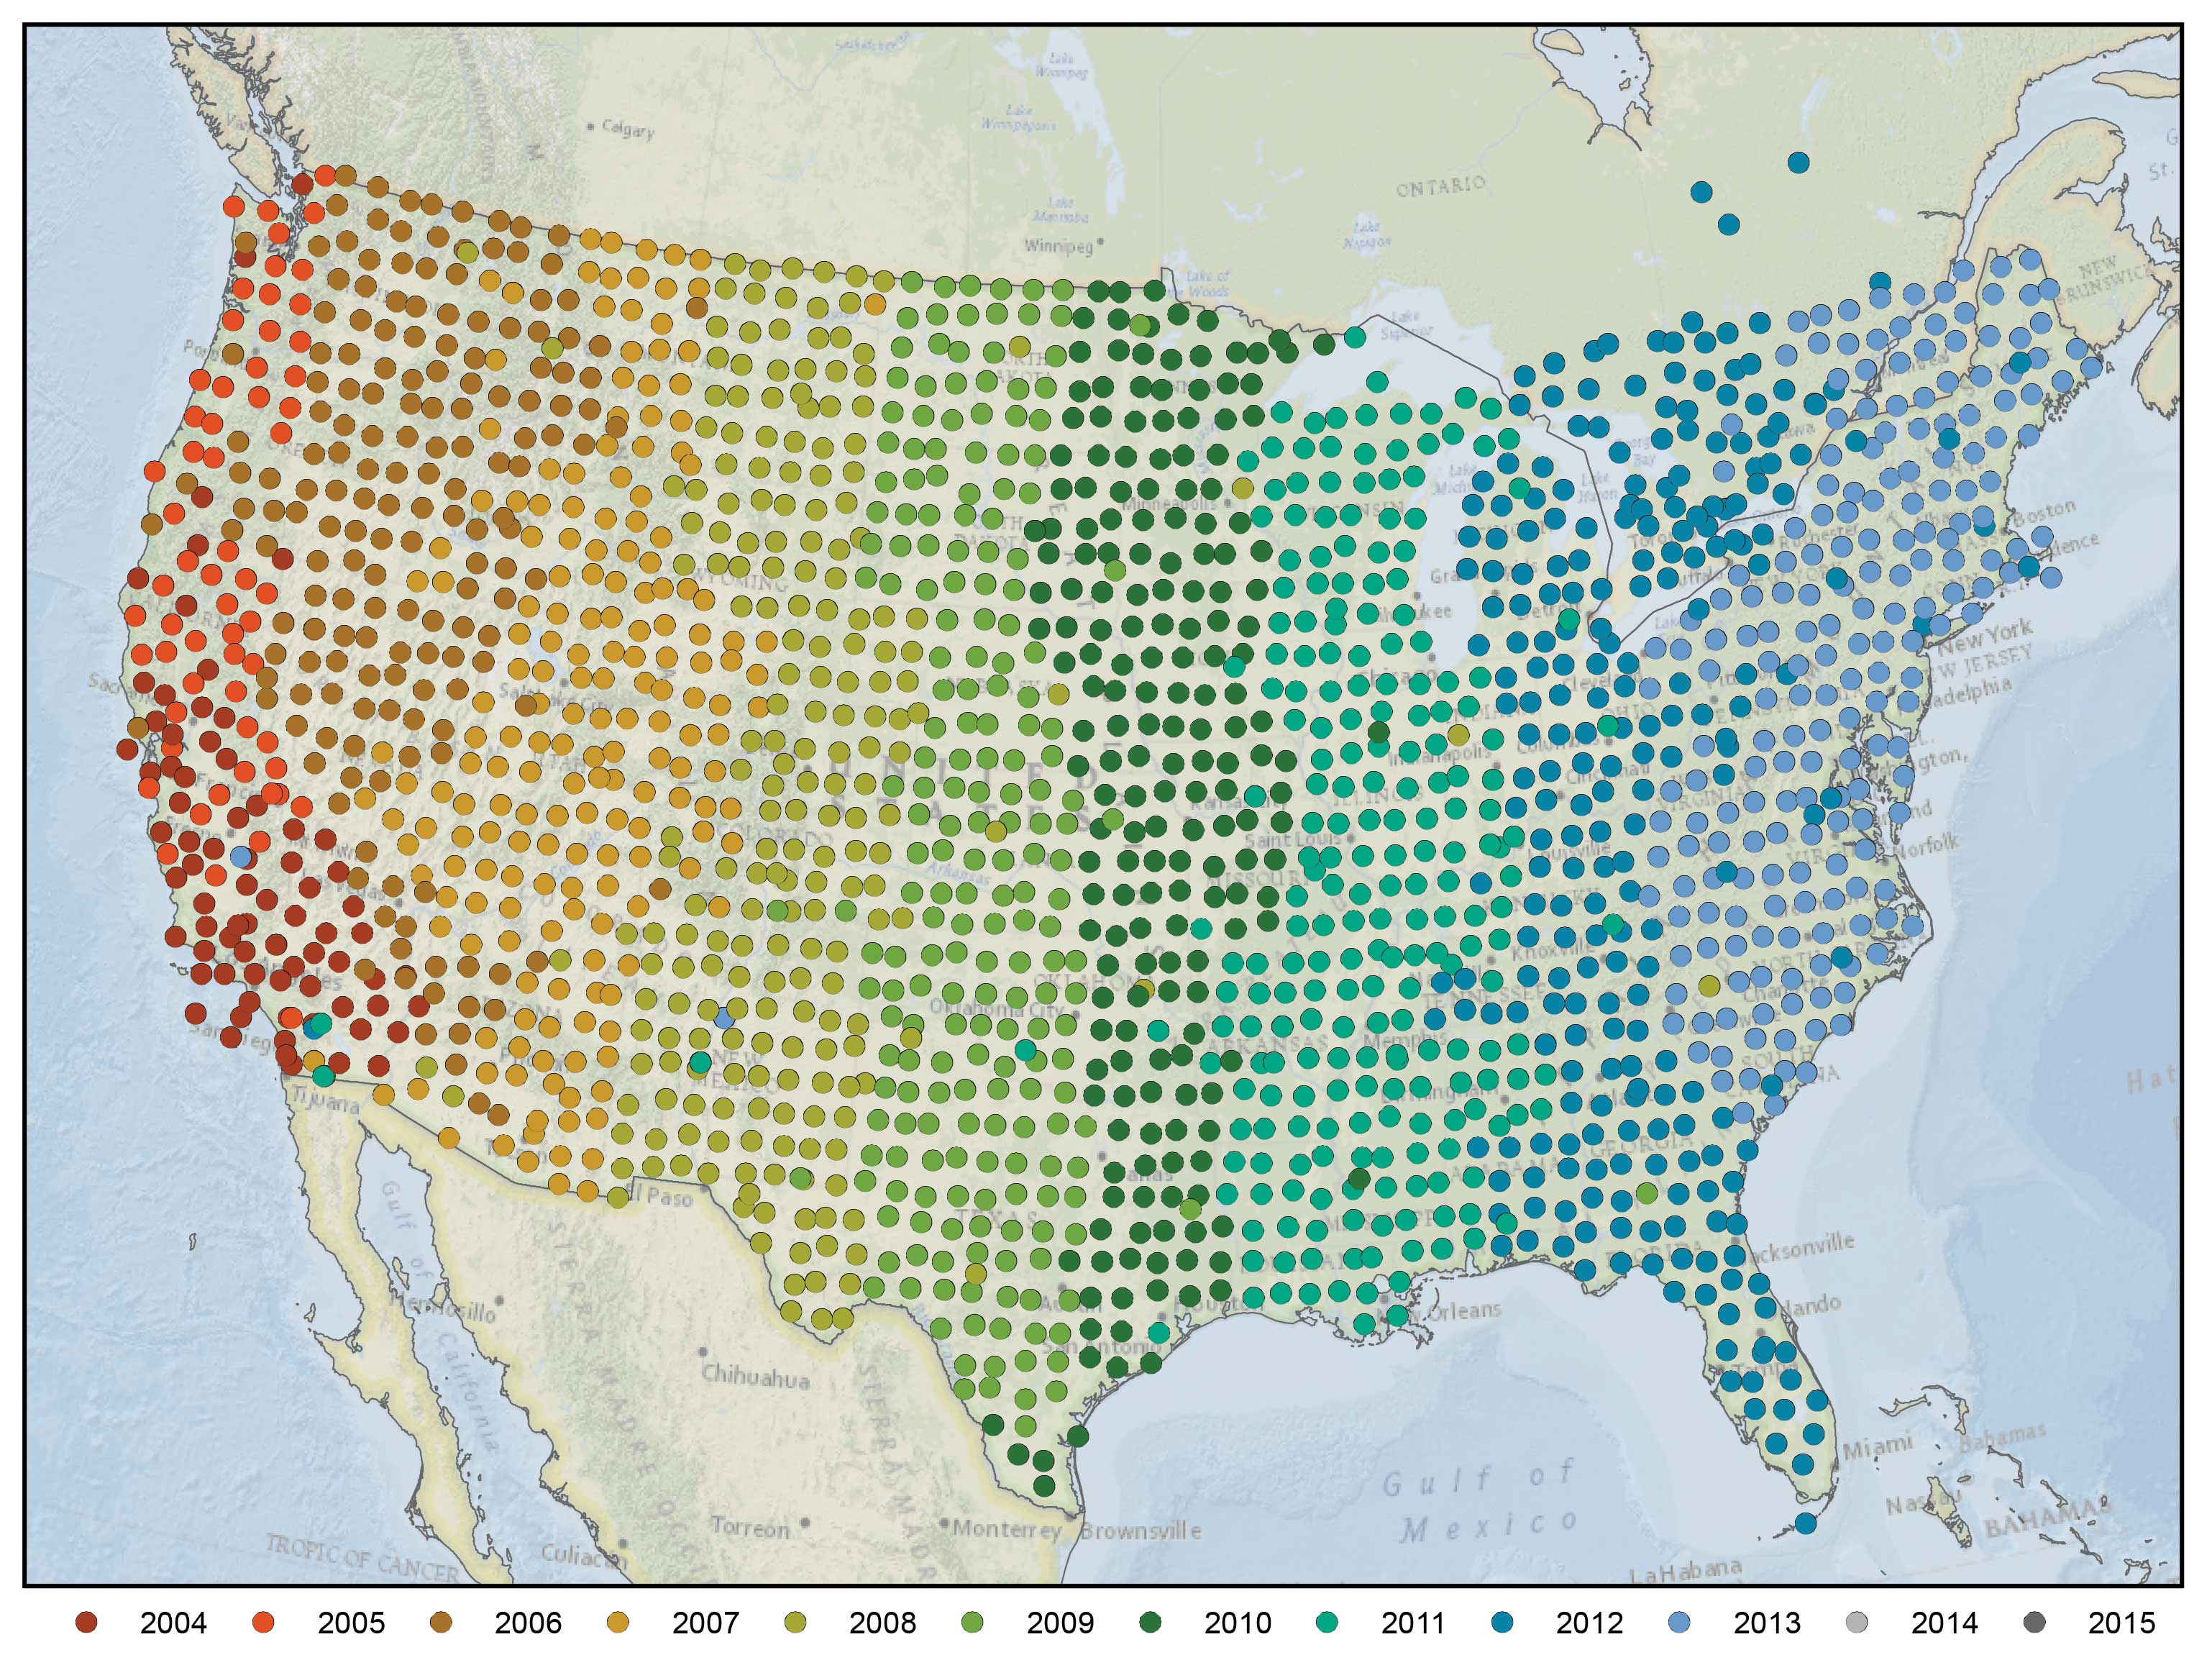
Over a period of ten years, 400 instruments known as the Transportable Array were deployed in a grid with roughly 70 km spacing across the entire Lower 48 states and part of Canada. The array was deployed in north-south strips starting in the west and steadily rolling to the east, with each seismic station in place for 18-24 months.
To visualize the instruments rolling over the US Click here
![]() By the time of the last deployments on the east coast, these instruments covered 2000 locations across the contiguous U.S and in Canada in the Great Lakes region. They faithfully recorded all seismic waves arriving at the station over the years giving scientists a large amount of data to work with. These data have given us a better "picture" of the interior of the earth than ever before - the more data we have and the closer the instruments are, the better the picture they produce.
By the time of the last deployments on the east coast, these instruments covered 2000 locations across the contiguous U.S and in Canada in the Great Lakes region. They faithfully recorded all seismic waves arriving at the station over the years giving scientists a large amount of data to work with. These data have given us a better "picture" of the interior of the earth than ever before - the more data we have and the closer the instruments are, the better the picture they produce.
The Transportable Array was supplemented by denser deployments in specific areas proposed by individual teams of scientists, called FlexArray experiments. These were part of focused investigations aimed at studying particular geologic processes or geologic events, such as fault slip, mountain building, continental rifting, or sedimentary basin formation.
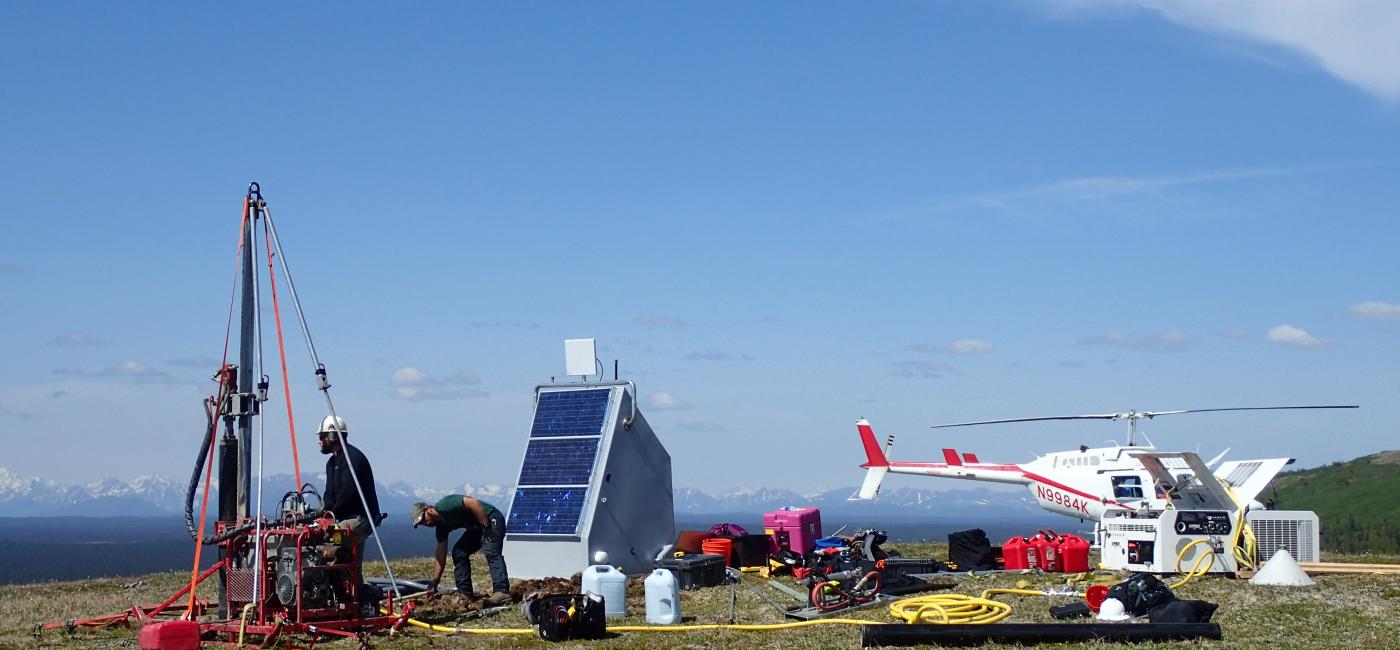
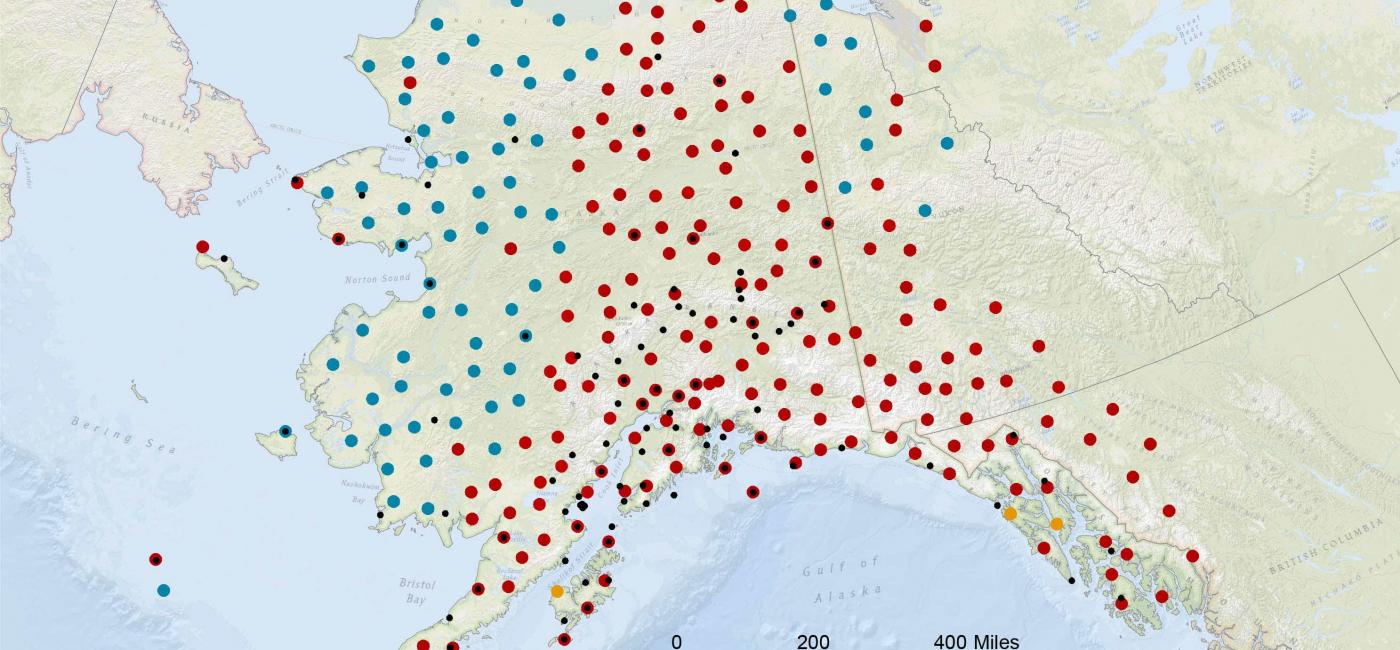
Starting in 2015, the Transportable Array began its final deployment to Alaska and Western Canada. Installing stations in Alaska, where road access is scarce and ground often frozen, is a big adventure, but the IRIS team has been up to the challenge and a roughly 85 km grid array will be completely deployed by the end of 2017.
A Network of GPS![]()
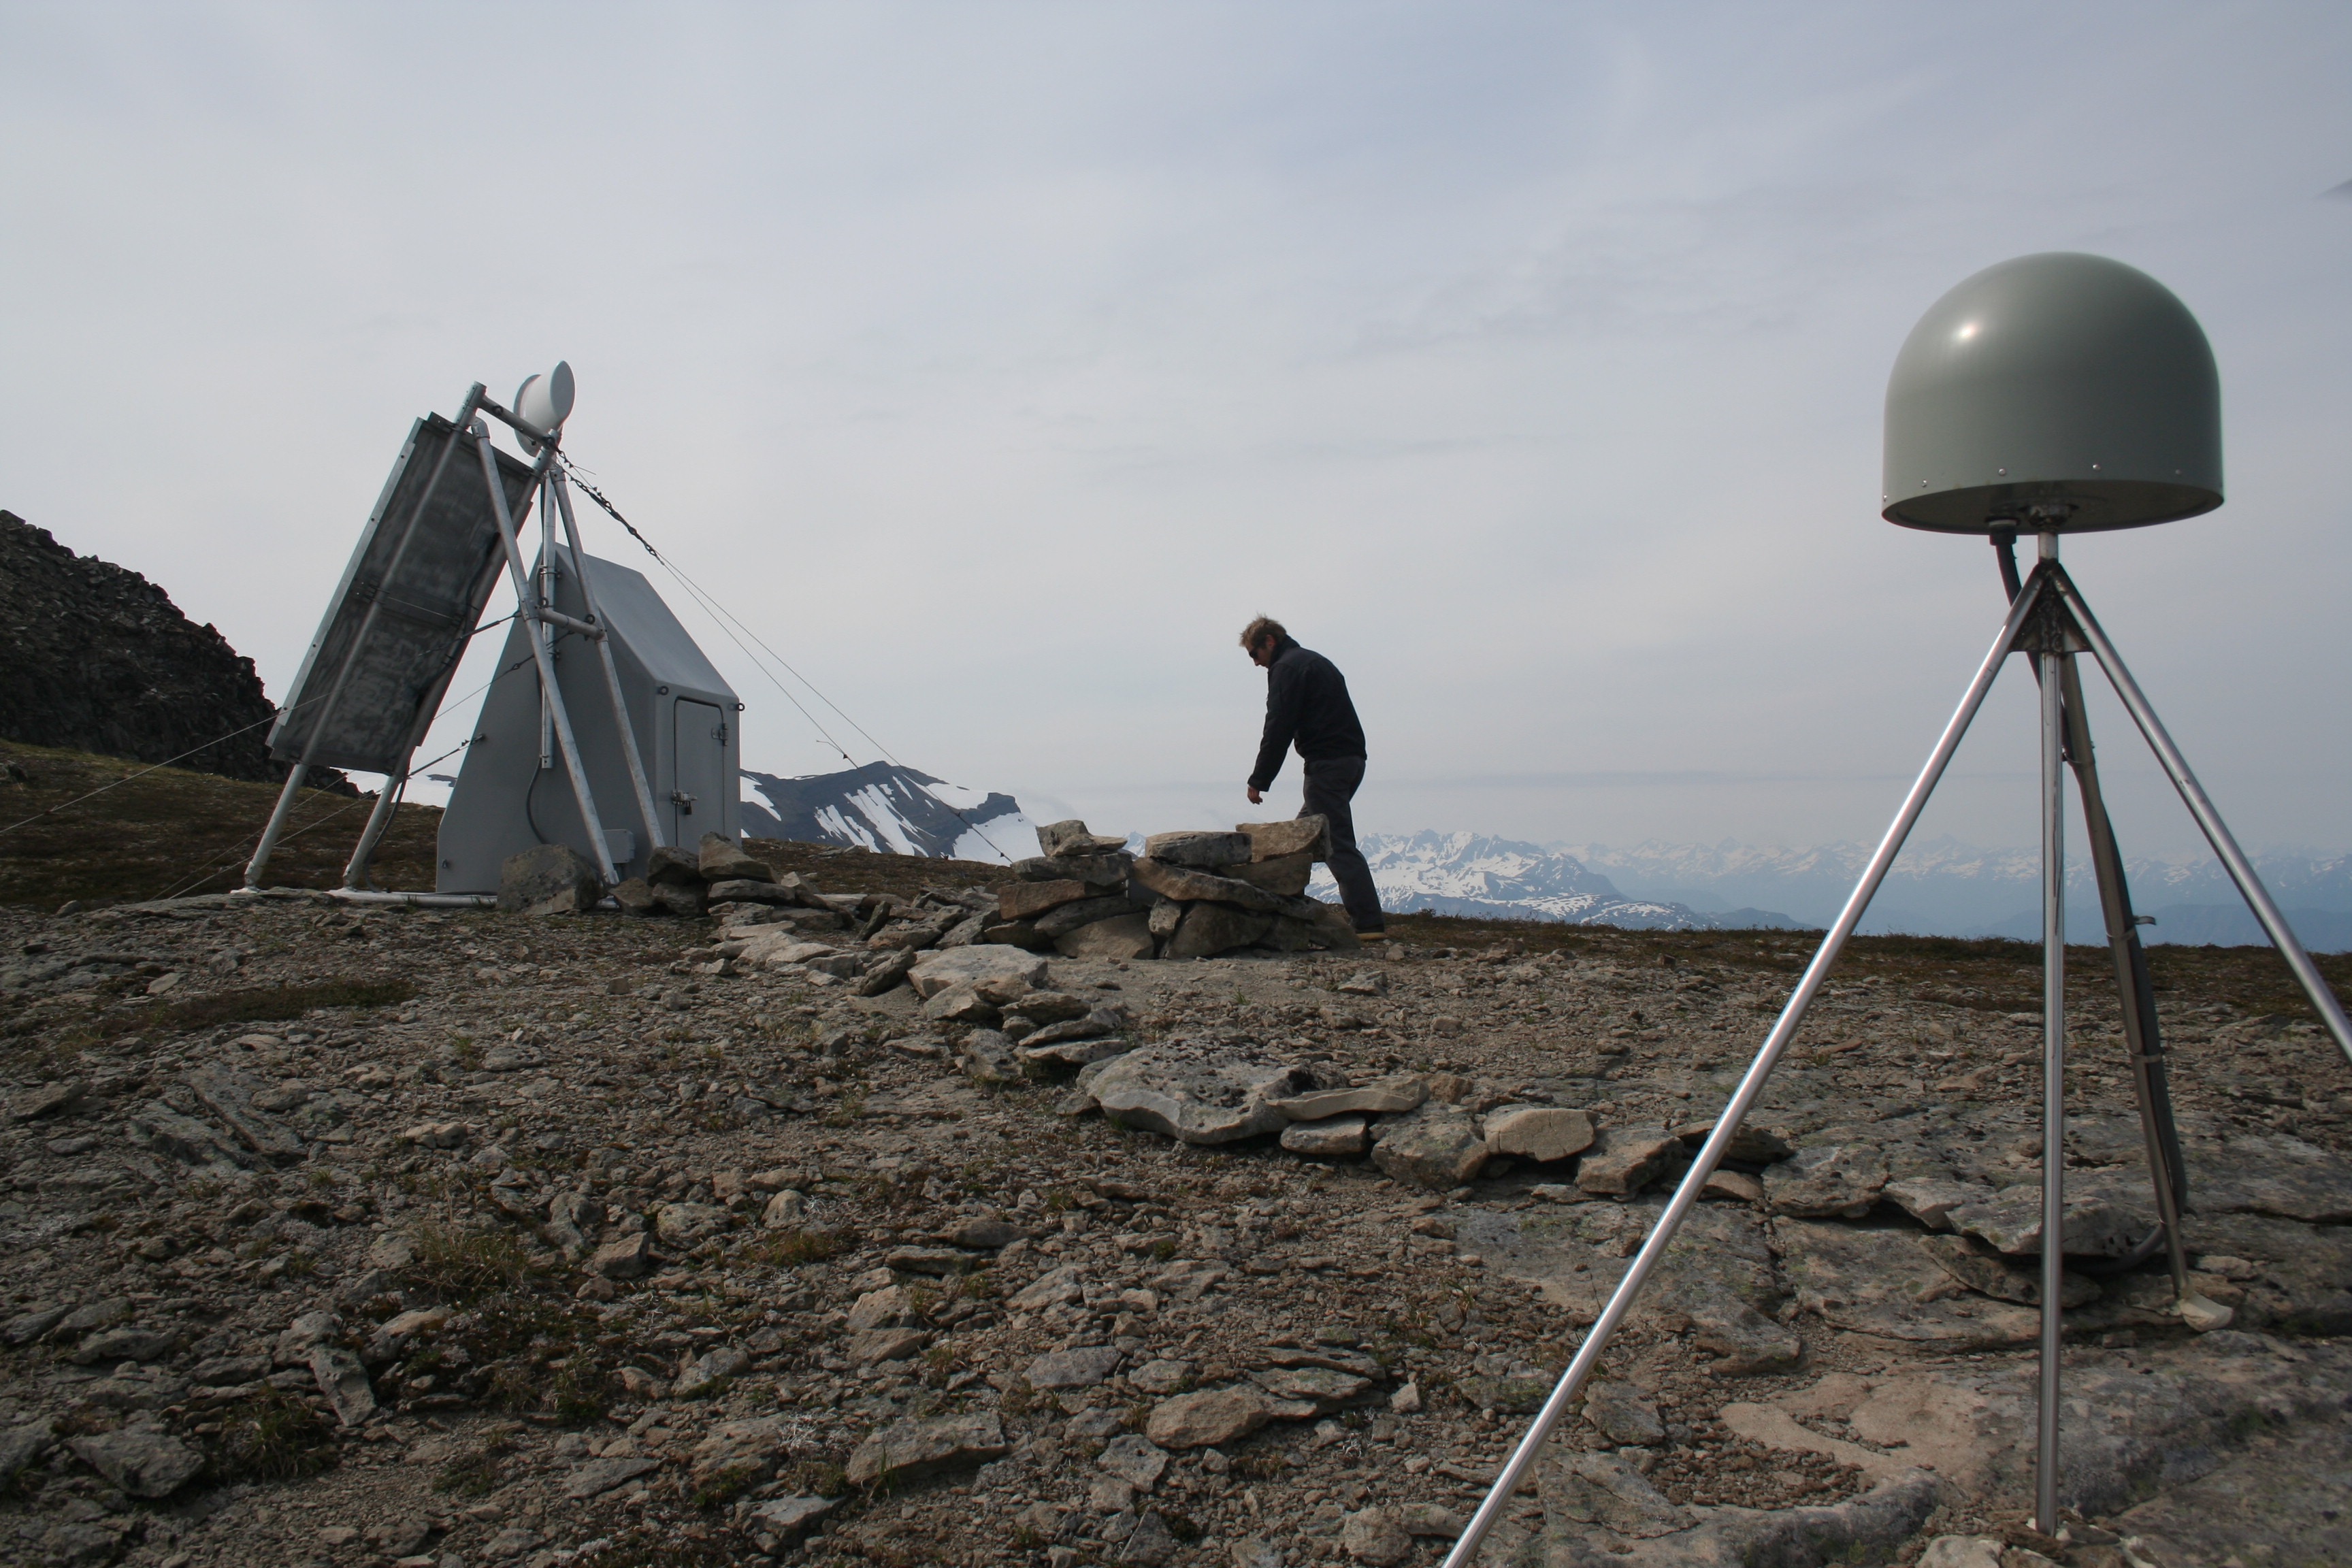
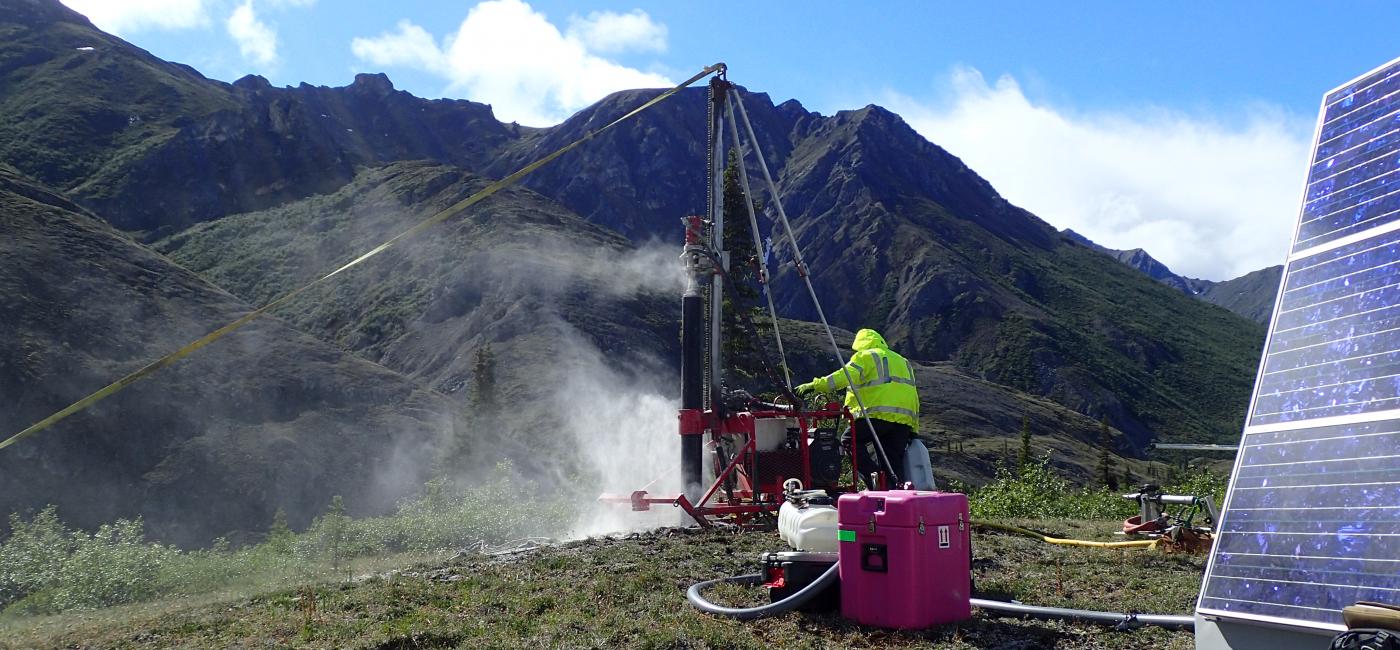
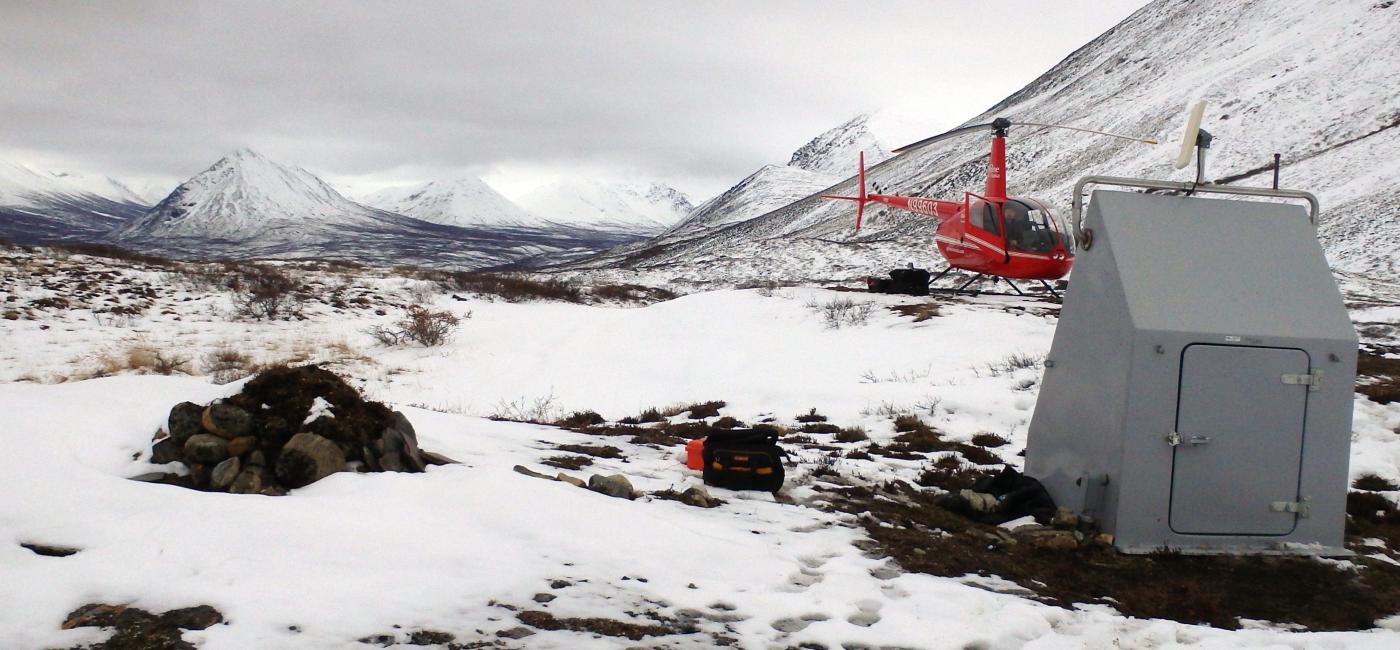
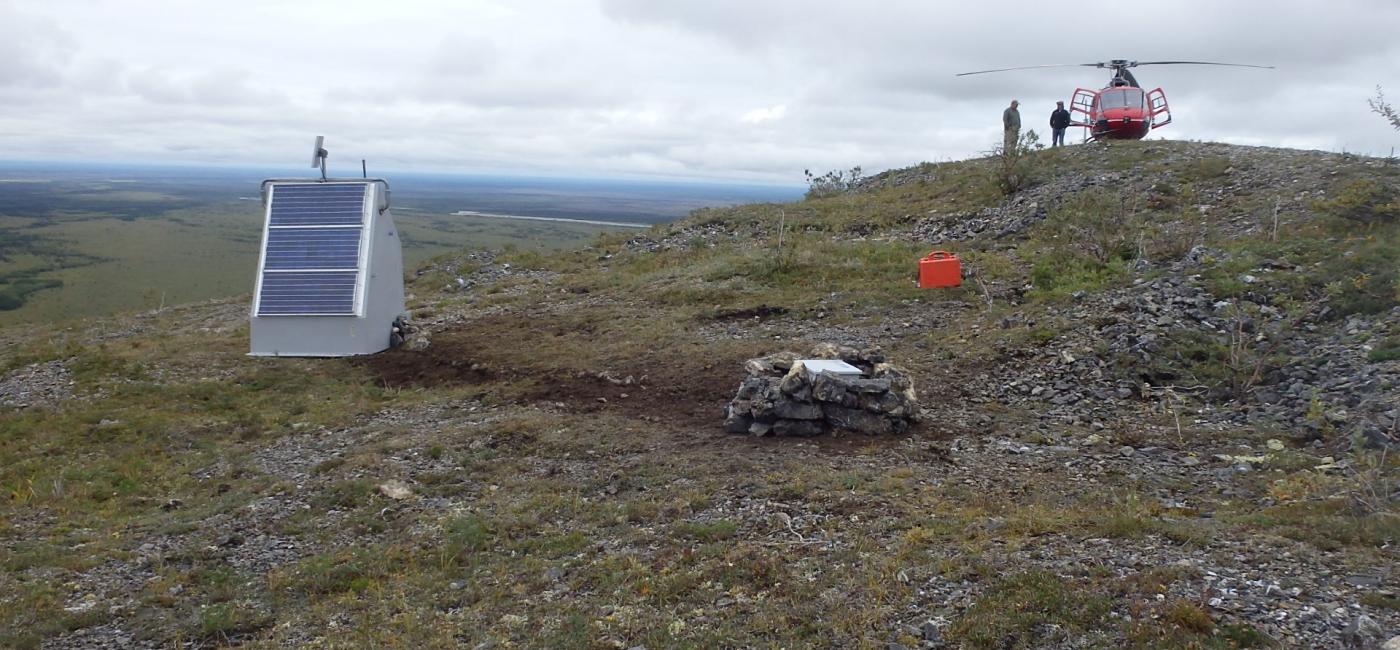
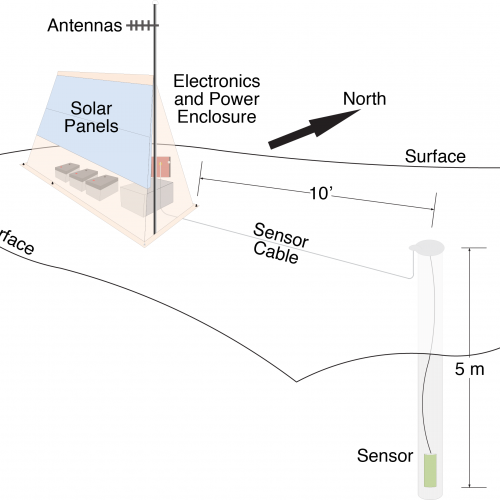
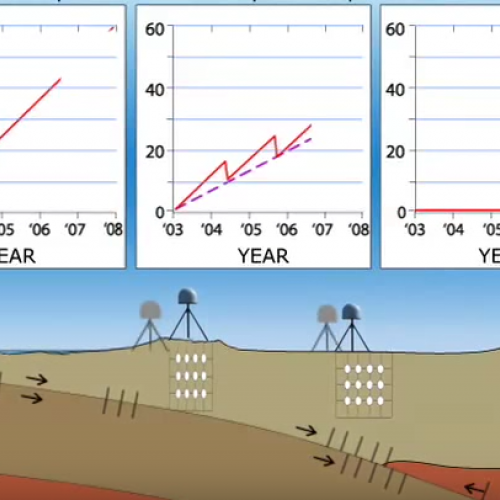
The Plate Boundary Observatory (PBO) is another EarthScope facility, operated by a non-profit university consortium for Geodesy called UNAVCO. PBO is a network of 1100 continuous GPS and about 100 strain instruments installed mainly throughout the western US and Alaska. Installed between 2004 and 2008, these permanent stations are used to measure the movement of the ground due to plate tectonics, earthquakes or magmatic inflation. The PBO instruments are strongly attached into solid ground so that they measure the motion of Earth’s crust accurately.
EarthScope has placed dense clusters of instruments along the Cascadia and southern Alaska margins, the two convergent margins within the United States.
New discoveries! The GPS network was mainly deployed to provide high precision (millimeter precision) daily positions to map out tectonic and other motions of the ground. However, PBO has measured other important deformation signals, including the uplift or subsidence due to variations in surface water/snow, and the drought in the western US. Innovative use of other information in the GPS signals has allowed the PBO network to be used for environmental sensing, to measure ionospheric activity, atmospheric water vapor, snow depth, vegetation height, and soil moisture.

Plate Boundary Observatory
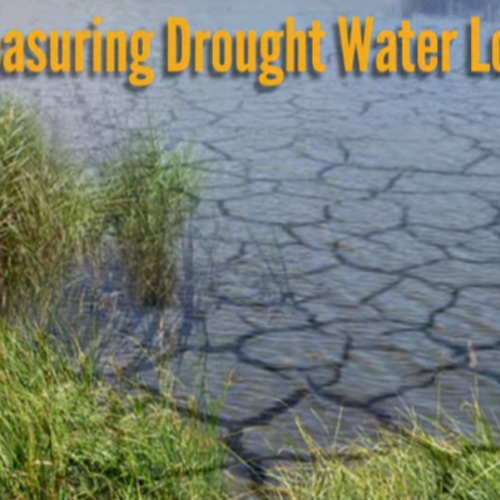
Measuring Drought with GPS
More than "just" GPS
As part of the PBO, EarthScope purchased or arranged for the acquisition of remote imagery of active fault zones across the western United States. InSAR and Lidar are remote sensing techniques that use radio waves and lasers, respectively, to image the topography of the earth.
InSAR uses repeat radar images from a satellite to measure topography and/or small changes in Earth’s surface. This makes it an excellent complement to the PBO GPS network, as when conditions are favorable it provides a map of ground deformation rather than only point-wise measurements.
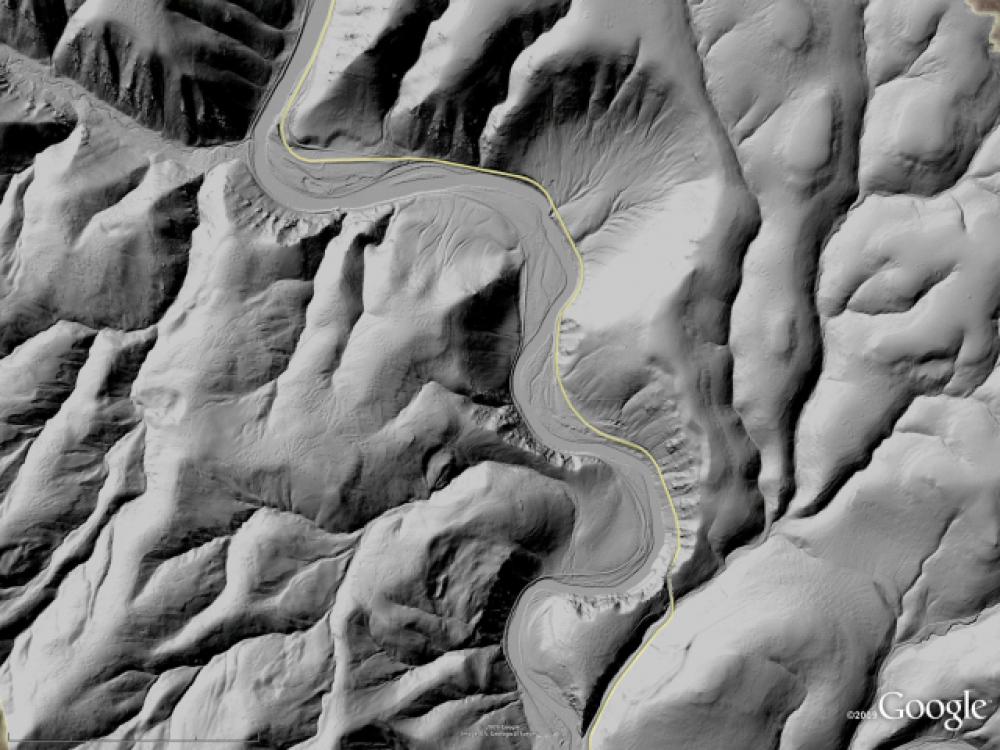 LiDAR systems bounce a laser beam from an aircraft off the surface to map out the topography. Because LiDAR uses a very high density of ground points, it can distinguish between the ground surface and the top of the vegetation. The shape of the ground surface in areas of active faulting can show where faults reach the surface and how far they have offset features on either side. EarthScope purchased 17 terabytes of InSAR data and 5,788km2 of high resolution LiDAR imagery. This corresponds to an area slightly bigger than Delaware State, on the eastern coast of the US. Explore more imagery in the OpenTopography portal at opentopography.org.
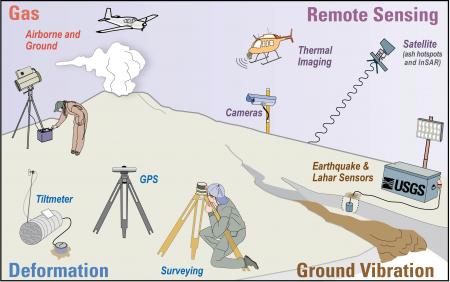
An interdisciplinary approach
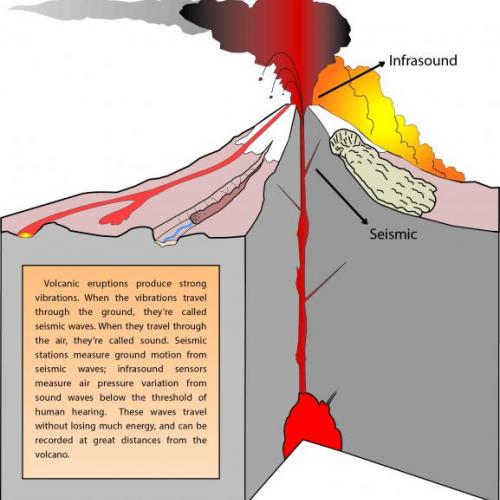
Seismic data is a fundamental tool that is used by volcano observatories to detect and warn of volcanic eruptions. Seismic data can be used in tomographic models also to image the magma chambers held below the imposing volcanic peaks, waiting to erupt. GPS and tiltmeters are used to measure volcano deformation and can help detect even small amounts of ground motion that can result as magma refills the crust and changes the surface shape of the volcano. Tomographic images of the mantle beneath the western United States, can be compared with geochemical data and volcanic eruptive volumes to understand better the relation between varying mantle melting rates and the ascent of magma through the crust.
Exploring an active fault
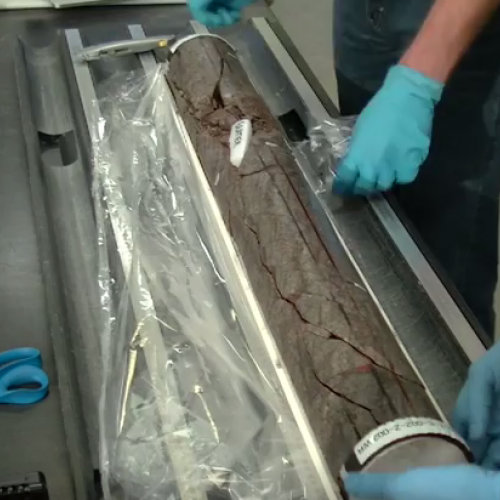
![]() We feel the shaking from earthquakes on the surface of the earth, but earthquakes actually begin deep inside the earth. The San Andreas Fault Observatory at Depth (SAFOD) was the deep drilling component of EarthScope: To be able to directly observe the conditions under which earthquakes occur, a 3.2 kilometer [2 mile] hole was drilled through California's most famous fault. The drill site is about 1.8 km SW of the San Andreas fault near Parkfield, CA, in an active earthquake zone.
We feel the shaking from earthquakes on the surface of the earth, but earthquakes actually begin deep inside the earth. The San Andreas Fault Observatory at Depth (SAFOD) was the deep drilling component of EarthScope: To be able to directly observe the conditions under which earthquakes occur, a 3.2 kilometer [2 mile] hole was drilled through California's most famous fault. The drill site is about 1.8 km SW of the San Andreas fault near Parkfield, CA, in an active earthquake zone.