
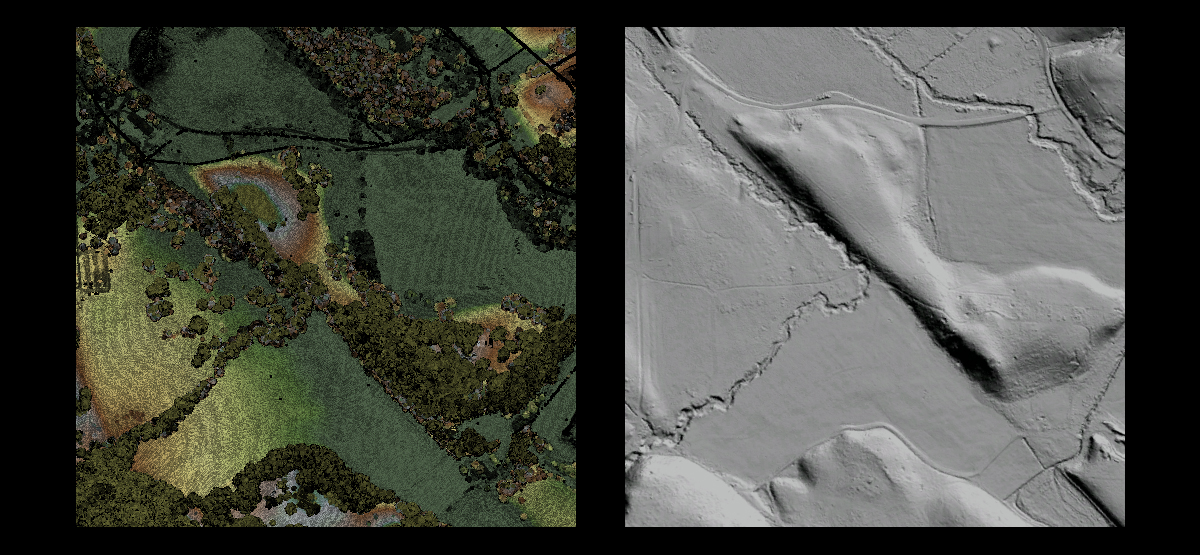
Above: Lidar data can be used to show surface vegetation (left) or a "bare earth" hillshade of the surface (right) of the same landform, a valuable tool for examining fault zones. These images show a topographic ridge that has been "carried" by movement on a strike-slip fault to block an existing topographic valley, deflecting a drainage or stream. The clarity of the hillshade clearly shows the stream direction as straight, then being deflected north to run parallel to the fault at the base of the ridge. (Images from the EarthScope Northern California Lidar Project data in the OpenTopography OpenLandform Catalog, a free resource for teachers, students, or any interested user.)
by Beth Grassi
Early in 2018, archaeologists uncovered hundreds of square miles of Mayan ruins in the Guatemalan jungle, thanks to a tool that earth scientists have been using for more than a decade. Lidar, which stands for light detection and ranging, precisely measures the height of objects, including the ground surface. This is useful for imaging landscape features such as fault breakages, where lidar can capture vertical surface offsets to an accuracy of about 15 cm (about 6 in).
An early EarthScope objective was high-resolution topographic mapping of major plate boundary faults in the western U.S. using lidar. It was part of an effort called GeoEarthScope, which ran from 2006 to 2009. The goal was to collect high-resolution topography and geochronology data to explore plate tectonics beyond the 10-year timeframe offered by GPS instruments of the Plate Boundary Observatory (PBO). The topographic data included a targeted lidar project.
EarthScope wasn’t first on the lidar scene. In 2005, the B4 project used lidar to scan the southern San Andreas fault in California. A joint effort of Ohio State University, the U.S. Geological Survey, the National Center for Airborne Laser Mapping (NCALM), UNAVCO, and others, the idea was to create a high-resolution image of the San Andreas fault before (“B4”) a major earthquake—to serve as a baseline. “It was really a bold idea to scan the San Andreas at a few samples per meter,” said Ramon Arrowsmith, Professor of Geology in Arizona State University’s School of Earth and Space Exploration and EarthScope National Office director from 2011 to 2015. “I always talk about B4 as the parent of the EarthScope data because it was inspiring and ambitious, but it also laid out what an open data set could look like to study faulting.”
Funded by the National Science Foundation (NSF), part of the B4 project’s mission was to offer the data free for use, encouraging a wide range of scientists and agencies to utilize it. At the time, lidar imaging was a new technique for studying faults. B4’s open data model fit EarthScope’s philosophy, and the detailed level of the B4 imaging proved lidar would be a valuable resource for scientists studying the plate boundary region. EarthScope’s contribution was that “it was the first time that a community of geoscientists had gotten together to identify and prioritize acquisition targets,” said Christopher Crosby, a project manager at UNAVCO and co-PI of OpenTopography, an NSF supported lidar data clearinghouse. “Since then it’s been done many times—other community initiatives that are collecting lidar for scientific purposes you could argue were modeled after, or look a lot like, the EarthScope method.”
The way lidar works is similar to radar, using eye-safe lasers instead of radio waves. The lidar instrument emits up to hundreds of thousands of laser pulses each second. Each pulse of light bounces off an object and returns to the instrument’s receiver. Because light travels at a constant speed, the time the laser takes to return allows a computer to calculate the precise distance to the target. The sensor is usually mounted in an aircraft (or on a tripod, ground vehicle, or satellite) and the sensor orientation and position are measured by inertial measurement and kinematic GPS respectively. Thus, the laser returns are located in a globally accurate sense to a few decimeters (about 11 inches or less) or better spatial accuracy. The vast number of data points, called a point cloud, forms a 3D image of the scanned area. This is the same technology being adapted for self-driving car navigation and obstacle avoidance.
What makes lidar uniquely useful is that it can “see” through even dense vegetation. There are typically at least small gaps in vegetation cover, and the tight pattern of the lasers finds enough holes to map the topography of the ground underneath vegetation. (The first video here is a nice primer on how lidar works.)
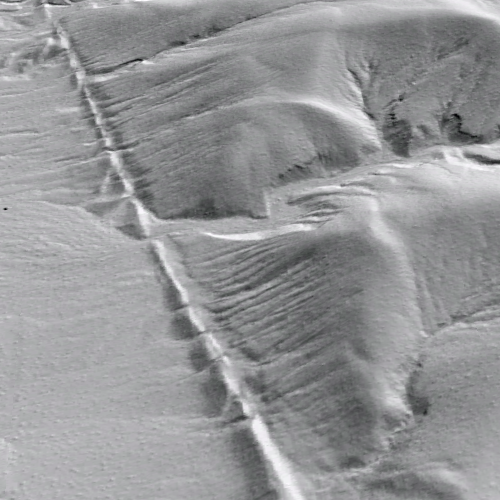
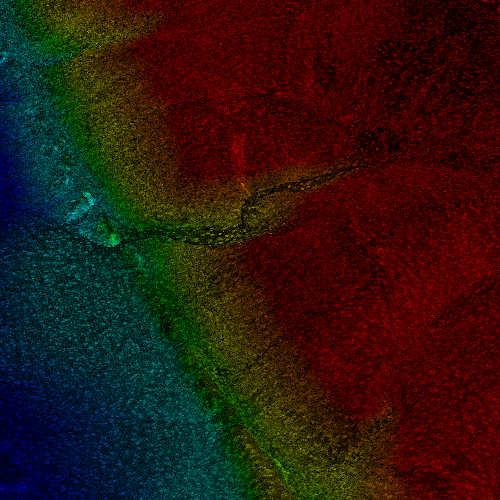
Strike-Slip Fault Trace: Garlock Fault Zone, Ridgecrest, CA. Left: Hillshade image. Right: point cloud image. The colors on the point-cloud image represent relative elevation, but the points are also colored by laser return intensity (i.e., reflectance/albedo in the near-infrared). (Image from EarthScope Southern & Eastern California Lidar Project.)
For earth science, lidar data are useful in a couple of ways. “The power of the active remote sensing of the laser penetrating the canopy gives us these really spectacular, bare earth topographic models that let us see the fault geomorphology under the trees,” said Arrowsmith. For densely forested areas such as northern California and the Pacific Northwest, the first lidar scans of active fault areas revealed faults hidden under dense forest and refined the maps of some known faults. (This paper covers uses of GeoEarthScope’s northern California lidar data.) This had interesting byproducts besides the obvious improvement of fault mapping—the Alquist-Priolo Earthquake Fault Zoning Act in California requires a geological survey if someone wants to build a structure within designated fault hazard zones. The California Geological Survey used lidar data to map more accurate earthquake fault-hazard zones.
Another benefit of lidar is its high-resolution and spatial accuracy. Each data point has a location—latitude, longitude, and altitude—associated with it and the landscape is typically sampled several times per square meter. This means that a scientist can examine even small elevation changes for evidence of previous fault activity. Scientists can use the lidar data to create a digital map of the landforms around a fault, then “rewind” (or back-slip) fault motion to reconstruct what the landscape may have looked like in the past, like a security camera that reaches back decades. (The second video here describes how lidar is useful for studying faults.)
EarthScope’s Inspiration
One of the biggest challenges of working with lidar data is the sheer volume of information, which requires a substantial amount of data storage and processing power. With origins in the NSF’s GEOscience Network (GEON) project to create cyberinfrastructure for earth science information, in 2008 the OpenTopography website became the official portal for the EarthScope lidar data and a few other early earth-science-oriented lidar data sets, including the B4 data. Today OpenTopography contains data from many other lidar projects around the world and other types of high-resolution topographic imaging data. OpenTopography offers researchers access to enormous amounts of data, with 1.1 trillion points online. Users can select data of interest, process them to make point cloud visualizations, digital elevation models, and other higher order grid products (hillshades, slope maps, flow accumulation for drainage area, etc.). OpenTopography has run more than 260,000 jobs processing more than 4 trillion lidar points—and counting.
Although EarthScope didn’t initiate the idea of using lidar to investigate geologic features, the EarthScope principle of open data sharing was one of the driving forces behind creating OpenTopography. Crosby started working with Arrowsmith in the early 2000s. At the time, Arrowsmith also had an interest in cyberinfrastructure and was working on a project on geoinformatics and computing in earth sciences. “I was talking about it with Chris and he said ‘you know, this lidar business is really a computational problem because it’s millions to billions of points, and what do you do with it?’” recalled Arrowsmith.
In 2006, a working group organized by UNAVCO and led by Dr. David Phillips, assembled to decide on GeoEarthScope’s lidar targets. The group focused on active faults in the plate boundary region from southern California to Alaska. A major discussion was how broadly to scan around each fault. Should it be a wide sweep encompassing whole watersheds? Or narrow to maximize the length of fault scanned? The group decided to focus narrowly on faults, scanning 500 m to 1 km wide swaths, wider only in key areas. EarthScope ultimately funded lidar fault zone data collection for six projects (See the map):
Northern California (2007)
Southern and Eastern California (2007)
Yakima, Washington (2008)
Alaska Denali Totschunda (2008)
Intermountain Seismic Belt (including Yellowstone National Park, Teton National Park, and the Wasatch Fault) (2008)
El Mayor–Cucapah Earthquake Rupture (2010)
The working group selected the targets in the first five projects based on a combination of fault motion and activity, earthquake hazard, and contribution to the overall knowledge of fault motion in relation to the plate boundary. The sixth project occurred in response to the El Mayor–Cucapah earthquake that happened on 4 April 2010.
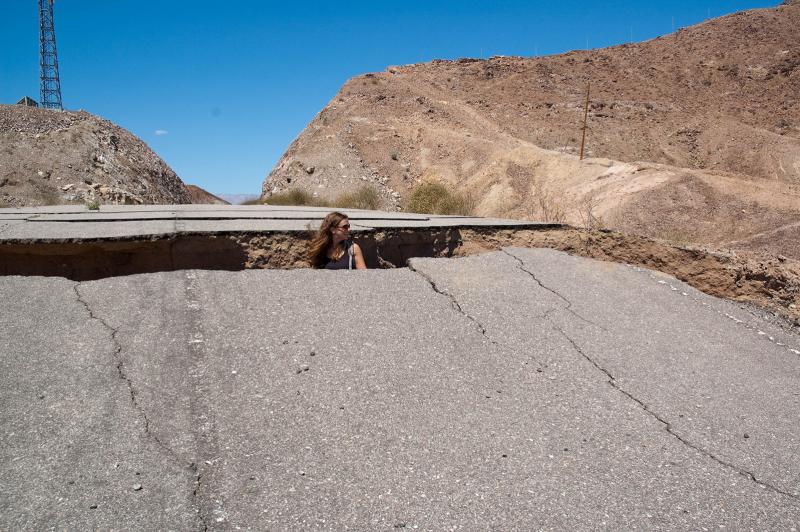
Above: Exploring the El Mayor–Cucapah ground rupture where it crossed a road in Baja California, Mexico. (Photo by Christopher Crosby)
The EarthScope lidar projects covered about 5,500 sq km (~2,100 sq mi), which raised a challenge—how to deliver that much data to the researchers who wanted to use it? Crosby and Arrowsmith were already working with the predecessor of OpenTopography. “UNAVCO ultimately contracted OpenTopography to host that [EarthScope] dataset because they appreciated that otherwise distribution was basically going to require either user-unfriendly FTP-type distribution or shipping hard drives to people, so we put it into OpenTopography,” said Crosby. “That dataset and B4 were the early datasets that drew people to use OpenTopography.”
Once the EarthScope data were available, another problem arose: many people didn’t know how to use it. “Lidar was a new type of data—earth scientists are not historically trained to deal with hundreds of millions or billions of individual xyz points. People typically work with rasterized datasets, so there was a bit of a learning curve.” Rasterized data is organized into a visual format, usually pixels arranged in a grid, with each pixel representing a single value, for example an elevation measurement. The richness of lidar point cloud data is that scientists could manipulate the “raw” data to create custom products for specific geographic areas, but they had to learn how to work with it.
GeoEarthScope supported a number of short courses to teach researchers how to work with the unwieldy information. In order to really understand the potential, researchers first needed to understand how the lidar sensors worked, limitations of the data, and how to process the data into usable formats.
The OpenTopography team didn’t stop there. Crosby transformed the point cloud data into images, called hillshapes, that users could browse in Google Earth. This opened the door for a whole new audience. “OpenTopography makes the data relatively easy to get to, but you still have to have some additional software to look at the data. Pretty much everybody had Google Earth, and you could download this small KMZ file and kind of ‘fly’ around Northern CA or wherever, and go wherever you wanted and look at the data,” said Crosby.
Arrowsmith said at first, he didn’t understand the need for different types of files. “What Chris was able to articulate in a really convincing way was that there are these tiers of data type or data products, and actually the simplest one gets used the most. A few people do really great science with these high-end data products, but for capturing the imagination of many people, including the scientists as they’re getting ready to work on fancier data products, those hillshades are really impressive.” OpenTopography now offers three levels of data: the Google Earth hillshades, raster images of preset geographic areas and resolutions, and the raw point-cloud data that researchers can tailor into custom selections and products.
Putting Lidar to Work
A practical earth science application of lidar data is called “differencing,” using lidar data to compare images of a landscape before and after an earthquake. Although a major earthquake has not happened in the five original areas since the EarthScope lidar surveys occurred, Professor Mike Oskin of University of California Davis along with Arrowsmith and colleagues put the technique into action with a RAPID EarthScope grant after the April 2010 El Mayor–Cucapah 7.2 Mw earthquake in northern Baja California, Mexico. The earthquake split the ground with a 120-kilometer long rupture. Approximately four months after the earthquake NCALM collected 372 square kilometers (144 square miles) of data over the ground rupture.
The El Mayor project offered several exciting opportunities for studying earthquakes. Scientists and students from the U.S. and Mexico headed into the field to do ground-based lidar scans mere months after the earthquake. The earthquake’s effects on the landscape in this desert region were highly visible, allowing for ground-based data gathering. Lidar data collected in 2006 by Mexico’s Instituto Nacional de Estadística y Geografía (INEGI) was lower resolution, but still valuable for comparison. “Even though the pre-earthquake data weren’t great, when they were compared to the post-event lidar data, we could do this pretty cool differencing,” said Arrowsmith (Read the paper or download the podcast from the Figures section)
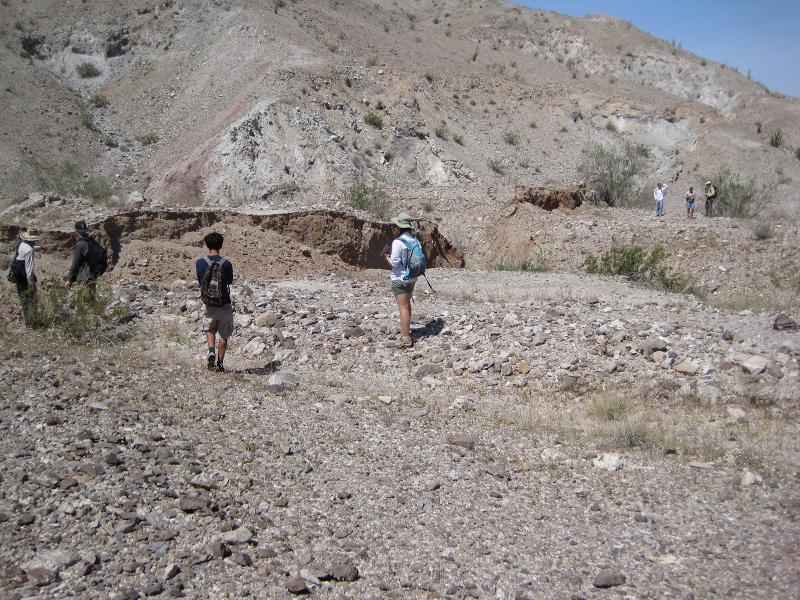
Above: Five days after the 4 April 2010 El Mayor–Cucapah earthquake, students and researchers from University of California Davis, University of California Los Angeles, and Mexico’s Centro de Investigación Científica y de Educación Superior de Ensenada (Center for Scientific Research and Higher Education at Ensenada) inspect the surface rupture formed along the Borrego Fault, planning for Terrestrial Laser Scanning of the scarp (the small cliff—caused by the earthquake—in front of the people). The photo shows the rupture across an active, northwest-flowing wash. This area quickly filled with sediment during a storm a few months later. (Photo by Michael Oskin)
The before-and-after lidar approach revealed a much more complicated fault system than previously mapped, including secondary faults that could spread or amplify an earthquake’s effects. The lidar images revealed that the El Mayor earthquake occurred along a series of smaller, secondary faults and a few undocumented faults in the Colorado River delta. It also showed warping of land between the smaller faults.
OpenTopography’s hosted GeoEarthScope and other lidar data has provided benefits beyond earthquake hazards studies. “A lot of the datasets were collected for very specific academic research purposes, but once you put them online and make them easy to use, people do all kinds of unexpected things with them,” said Crosby. For example, the Los Trancos Open Space Preserve, located in the Santa Cruz Mountains in northern California, used the data to update trail maps. This page describes the geology of the preserve, including a trail where you can see the San Andreas fault, and shows some examples of lidar maps of the trail area compared to photos. Another example is virtual world development for video games. “We see a lot of use from video game developers, people building games, who want realistic landscapes at high resolution,” said Arrowsmith.
Lidar In the Classroom
High-resolution lidar images are now working their way into the classroom, too. Beth Pratt-Sitaula, who runs UNAVCO’s undergraduate education program and was an EarthScope Speaker Series speaker in 2017–18, helped start UNAVCO’s Geodesy Tools for Societal Issues (GETSI) project using a variety of EarthScope data, including lidar. Through GETSI, undergraduate students are more engaged in learning because the topics are relevant to real-world problems. “Good lidar data of geologically active areas is valuable for students. It helps them learn about surface features that indicate tectonic activity,” said Pratt-Sitaula. There are now several GETSI teaching modules available for educators, including lidar modules (see the Teacher Resources below).
As a tool for teachers, lidar fits a range of topics for earth science literacy. “These data are so useful for so much: it’s earth as a system, it’s the basic geomorphology, it’s hazards—there’s a lot of geoscience, but there’s also the technology,” said Arrowsmith. “Measuring lidar is pretty intense geodesy. You have to have good kinematic GPS, you have to have inertial navigation, you have to be able to process 100,000 pulses per second of laser ranging.”
Last year, Arrowsmith and Crosby, along with co-authors Sarah Robinson, Wendy Bohon, and Emily Kleber, published their paper exploring high-resolution topography, mostly based on lidar, as a teaching tool. In the paper, they summarize motivating earth science literacy objectives and present the results from several assessments with students using the data. They demonstrate how effective high-resolution topography is for teaching undergraduate students to recognize surface features caused by earthquakes.
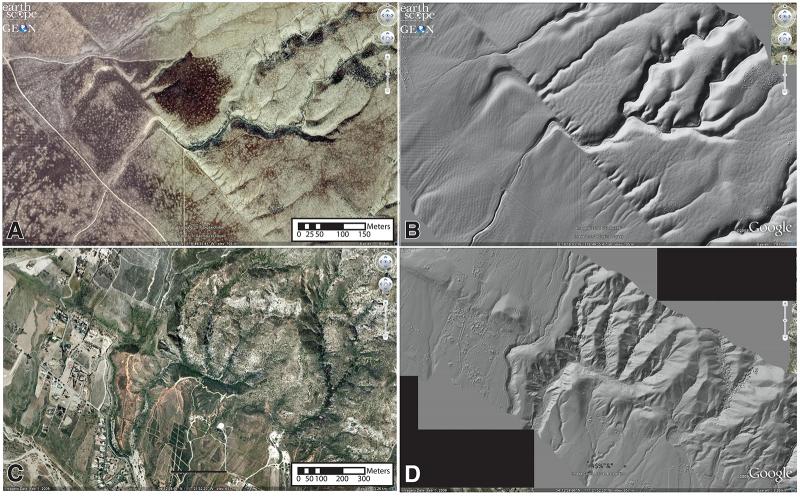
Above: Imagery given to students for distractor study. (A, B) Wallace Creek at the San Andreas fault (SAF, California, USA [35.271681, –119.827691]) shown in both Google Earth imagery (A) and lidar-derived hillshade (B). (C, D) The San Andreas fault near San Bernardino (34.216817, –117.364555) shown in both Google Earth imagery (C) and lidar-derived hillshade (D). The hillshades have significantly less distracting features and more landscape-relevant detail. (Image from Robinson et al.)
In one experiment, the researchers asked students to use images to make observations based on images of two locations along the San Andreas fault, one with minimal infrastructure near a straightforward strike-slip zone, and the other including more infrastructure near a more complicated fault structure. One set of students received Google Earth satellite photos. Another set of students received lidar hillshades, stripped of vegetation and buildings. They received no instruction on identifying faults. Students viewing the lidar images “were able to more accurately identify faults (as much as 38%) compared with students looking at Google Earth images,” wrote the authors.
This test led to two sample educational tools: a video introducing earthquake science using lidar imaging, and an exercise introducing the San Andreas fault earthquake cycle. For the latter, students imported lidar images into Google Earth to view and measure fault-related features. Students’ understanding of how lidar is used to study earthquakes improved, as did their grasp of landscape evolution through earthquake cycles.
EarthScope Legacy in Lidar
The technology continues to evolve. In the past few years, with the lower cost of flying drones, they have been harnessed to collect topographic data using photogrammetric methods (combining multiple photographs from different angles to create 3D images) and in a few cases, lidar data. EarthScope’s role in fostering wider accessibility has helped build the foundation for using such data for earth science research and education. The GeoEarthScope archive is now 10 years old, and is a valuable resource for marking change. “If there is an earthquake, landslide, erosion, construction, anthropogenic phenomena—all these can be compared against the pre-data, which is what the EarthScope data are,” said Arrowsmith. “Because they were gathered in an open and careful way, they’re well documented, they act as this great investment for the future. With time, their value will increase.”
Teacher Resources
These teaching modules make use of lidar images. They are available through Geodesy Tools for Societal Issues (GETSI):
Surface Process Hazards: Unit 2 Reading the Landscape
Imaging active tectonics with InSAR and lidar
More visual resources:
The OpenTopography OpenLandform Catalog serves as a resource to explore geologic landforms in high resolution digital topography for teachers, students, or any interested user.
The first video here shows how lidar works
The second video here describes how lidar is useful for studying faults; it shows an example of how scientists can rewind a fault’s image.


