
By Dr. Adam Schultz - Spring 2016
While staying true to its intent as a telescope to peer into Earth’s interior, EarthScope has also been looking up to the heavens. In 2015, SRI International and Oregon State University, with the assistance of Zonge International and Green Geophysics, deployed a Data-Fusion Imaging Observatory for Space and Solid Earth. This project sits in a region where it intersects with cratonic North America, and is positioned to answer fundamental questions about the structure and conditions within the broad Alaska continental margin. It also examines how electric currents in the ionosphere couple to the solid earth below.
The solar wind, magnetosphere, ionosphere, and atmosphere are coupled to Earth’s crust and mantle by electromagnetic induction, with geomagnetically induced currents arising from geomagnetic disturbances and penetrating deep into the planet. The currents are a major threat to communications and navigation systems, and can prematurely age the electric power grid and pipeline systems. This happens during extreme space weather events— Toronto’s stock market came to a halt during the geomagnetic storm that triggered the 1989 Quebec Hydro blackout.
The intensity of geomagnetically induced currents in the power grid is highly dependent on the 3D electrical conductivity structure of the crust and mantle. However, research in the Atmospheric and Geospace Sciences and the Earth Sciences communities is decoupled across the air–earth boundary by a set of assumptions and simplifications that limit the interpretation of data and may mask unexpected effects.
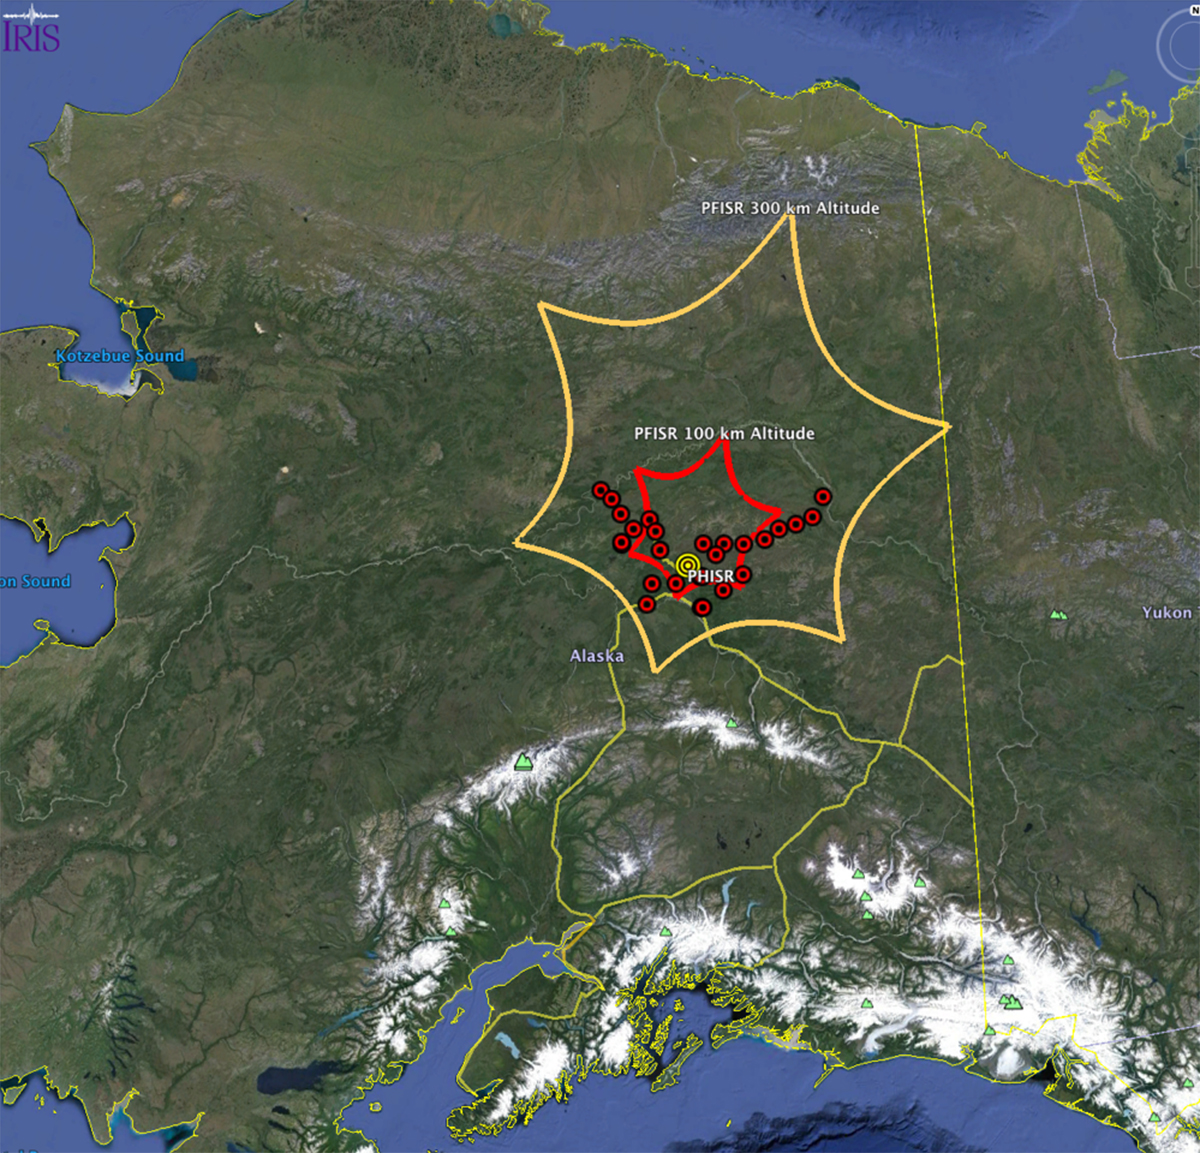
Near Fairbanks, Alaska, under the auroral oval, is a particular kind of multibeam radar—the Poker Flat Incoherent Scatter Radar, or PFISR—with a multispectral all-sky imager and an imaging Fabry Perot interferometer. By combining these facilities with the pool of magnetotelluric (MT) instruments operated by the National Geoelectromagnetic Facility at Oregon State University, a synchronous array of 25 MT systems was installed and operated in late 2015, under the Poker Flat instrument’s field of view. The datasets are being fused to produce time-evolving 3D images of auroral arcs, including the current systems that connect them to the magnetosphere through field-aligned currents and that are the signal source for MT imaging of Earth’s interior. The first view of the electrical conductivity structure of the Alaskan interior’s lithosphere and upper mantle is being produced, along with a transect of the Alaska margin, through the Cordillera, and into cratonic North America.
This regional imaging observatory covers a range of scales for 2D and 3D ground-conductivity imaging under the Poker Flat instrument’s field of view, with two nearly linear arrays—one extending 200 km to the northeast, and a second orthogonal to the first, to sample across several terrane boundaries within the broad Alaskan interior continental margin.
The 25 long-period MT instruments were spaced roughly 20 km apart and operated synchronously with PFISR. The survey design was developed to simplify logistics—all of the stations are located near the few maintained roads in interior Alaska.
One of the MT profiles encompasses two spurs of the Tintina fault zone, an active plate-boundary zone between the Yukon–Tanana Terrane to the south and cratonic North America to the east. The other crosses several poorly delineated southwest-northeast–trending fault systems, potentially including the Susulatna and Kaltag faults and several terrane transitions. The full profile footprints provide a sufficient aperture to generate full midcrustal to upper-mantle electrical conductivity sections to depths of ~300 km in this transitional region, which is currently completely absent.
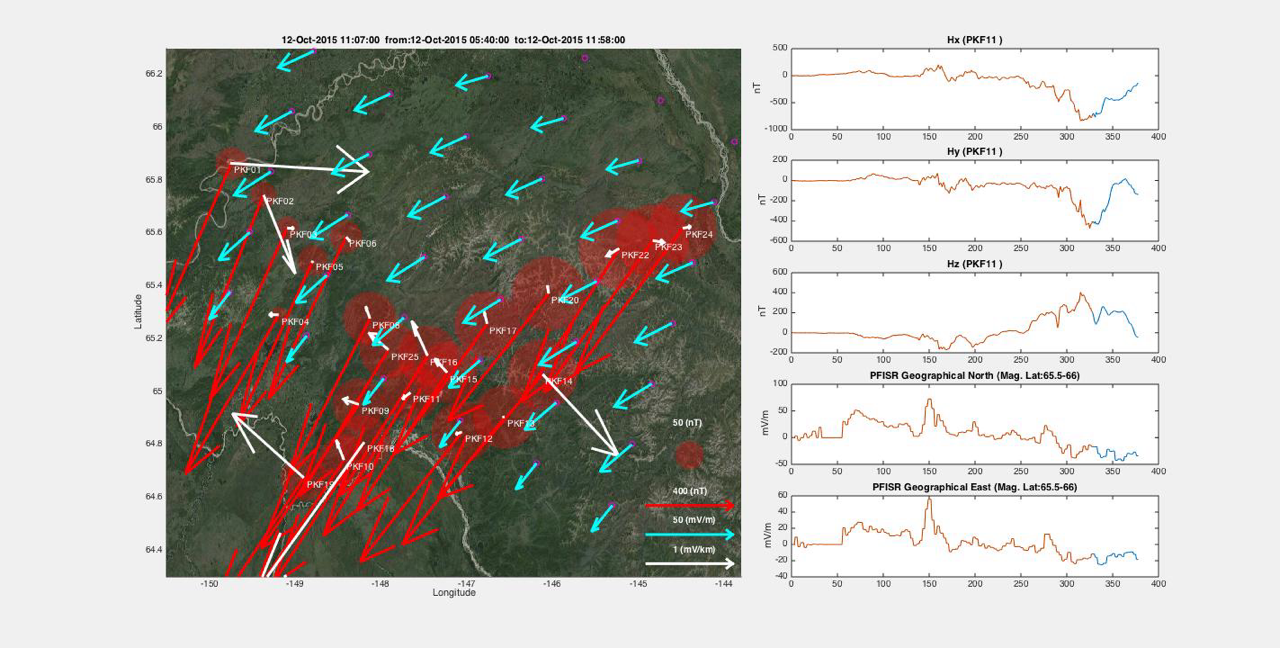
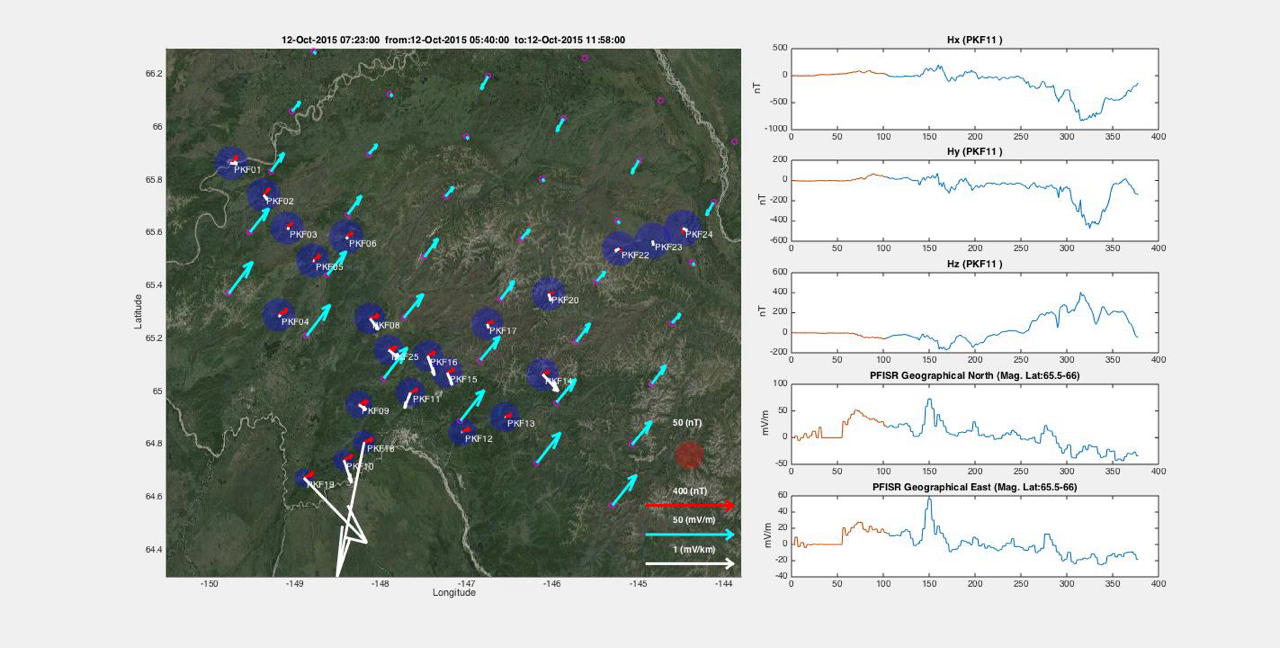
Preliminary results illustrate the relationship between the magnetic and electric fields measured at Earth’s surface at the MT stations, and the electric field projected to the base of the ionosphere due to the 3D ionospheric Hall currents as inferred from PFISR measurements. The strongly non-uniform response of the electric fields at ground level, relative to the more uniform ionospheric inducing fields, is particularly notable. For an Earth with uniform or 1D conductivity structure, the electric fields at ground level would be orthogonal to the magnetic fields, and ground-level and ionospheric electric fields would be aligned. Clearly this is not the case, which is particularly evident during the more disturbed interval show, and indicates underlying 3D Earth structure. Furthermore, the assumption that is typically made for MT analyses, that the inducing field is plane-wave in form, also does not hold in this region.
Much is left to learn from this remarkable data set. In order to fully tackle the complexities and richness of both ionospheric and solid-Earth content in these signals, a new method of MT data analysis is under development to handle the complicated nature of the ionospheric source fields. The MT waveforms and the ionospheric field data set are jointly inverted in the time domain for 3D Earth conductivity structure and for ionospheric current distributions. While computationally demanding, we are learning that this problem is tractable using GPU accelerated parallel computing methods. We look forward to reporting later this year on new insights into the structure of the Alaskan lithosphere, asthenosphere, and ionosphere from application of these new methods to this unique EarthScope/ Aeronomy and Magnetospheric Physics data set.
Top Figure: Site map of the magnetotelluric (MT) array installed in the Alaska interior in 2015. The Poker Flat Incoherent Scatter Radar (PFISR) facility at Poker Flat, AK, just north of Fairbanks, is located at the intersection of the two MT profiles. The red- and mustard- colored star shapes represent the footprint of the PFISR radar at 100 km and 300 km altitude, showing the area of ionospheric electric fields imaged by this system.


