
by Gail McCormick - Fall 2016
The most active volcano in Cascadia has a lot going on downstairs. Earthquakes are common under Mount St. Helens, but they don’t all originate from tectonic forces, which are the most common culprit for earthquakes globally. Generating and moving melt under a volcano can also cause earthquakes, motivating scientists to resolve the links between earthquakes and magmatic processes. To do so, researchers at Mount St. Helens are working to gain a better understanding of the volcano’s innards. From this pursuit was born the iMUSH project—imaging Magma Under St. Helens—a collaborative effort funded by the NSF GeoPRISMS, EarthScope, and Geophysics programs. The project has enhanced the image resolution of subvolcanic structures by temporarily tapping a deployment of nearly 6,000 seismometers in an area that is normally monitored by about 15.
“A lot of people would have a cartoon of a volcano in their mind that has a balloon of liquid magma downstairs. Probably not too many volcanoes look like that,” says Dr. Brandon Schmandt, Assistant Professor of Geophysics at the University of New Mexico (UNM) and a member of the interdisciplinary team investigating the plumbing system beneath St. Helens. He joined a team of seismologists from University of Washington, Rice University, Cornell University, and the Cascades Volcano Observatory who designed the seismology portion of the project. (See the iMUSH and USArray support websites for more information).
Understanding the Mount St. Helens plumbing system has long been an objective of geologists. With enhanced imagery made possible through the considerable increase in seismometers near the volcano, they are starting to see that magma may occupy multiple chambers at various depths.
The instrument array of the iMUSH project captured seismic waves reflecting and refracting off of subterranean rocks, in a manner similar to a CAT scan. In addition to enhancing the subvolcanic imagery, the large number of recording stations greatly boosted their power to detect tiny tremors that previously slipped under the radar of the pre-existing smaller network, enabling the iMUSH team and their colleagues to better determine when and where earthquakes are occurring under Mount St. Helens.
Magmatic structure and small earthquakes provide complementary information that may help iMUSH researchers be able to better link the earthquakes to magma transport and eruptive activity. “We might be able to better identify if changes in earthquake activity are related to magma movement or if they’re just related to tectonic stresses jostling things around,” says Schmandt.
The temporary array placed around the mountain includes 70 broadband seismic stations (provided by IRIS) that just finished a two-year recording gig, 904 smaller seismometers (from the company NodalSeismic) that recorded for two weeks in summer 2014, and about 5,000 other small seismometers (also IRIS provisioned) that focused on recording controlled explosions. The 904 seismometers that recorded continuously for two weeks were all within 15 km of the volcano where nine long-term seismometers normally operate as part of the Pacific Northwest Seismic Network. These units, called nodes or cable-free seismometers, were originally developed by the oil and gas industry to find subsurface oil and gas. Deployment of the nodes by a team from UNM was a late add-on to the iMUSH experiment in summer 2014.
Schmandt describes the nodes as cylinders six inches tall by five inches wide. “They’re the size of a big soup can,” he says. The nodes are self-contained and include a battery, a GPS clock, internal memory, and a geophone that measures ground movement. They’re completely cable free, which, when combined with their small size, means they can be deployed rapidly and in great numbers even in the wilderness.
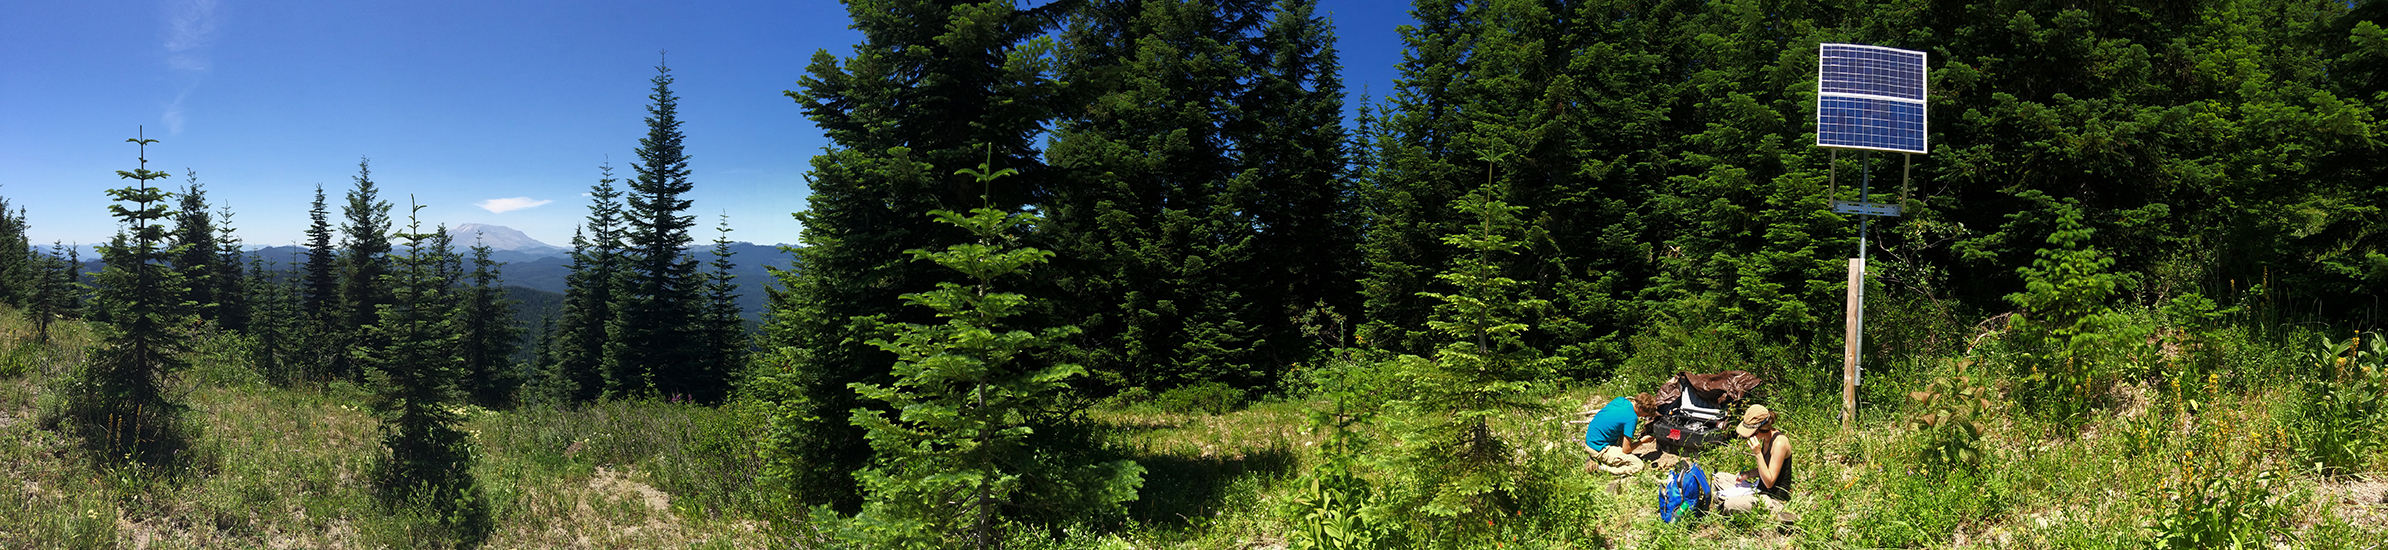
“Generally the passive, or natural-source, seismology community has worked with many, many fewer stations,” says Schmandt, “which have a much bulkier setup with an external power system and a solar panel.” A power system allows the larger broadband stations to record for a few years with proper maintenance and to record across a larger-frequency range than the nodes, but their more entailed deployment is limiting. “If we just have to stick a soup can in the ground, we can install a lot more.”
The trade-off with deploying many instruments is usually time. Large numbers of smaller-sized instruments make for short-term experiments, typically only recording for 24 hours. In 2014, the 904 nodes around Mount St. Helens recorded continuously for two weeks, roughly the extent of their battery life. Although two weeks seems like a short period, it greatly boosted the earthquake monitoring array over that time and provided the largest continuous seismic dataset for an active volcano.
Identifying Earthquakes
Continuous seismic monitoring using nodes has only recently been adopted by the research community, and Schmandt and colleagues demonstrated their ability to monitor earthquakes in the shallow crust. They used a method called “reverse-time imaging” to automatically detect small earthquakes, or microseismicity, with the dense array.
“The previous network would have detected about 50 earthquakes,” says Schmandt. “At this point using our array, we’ve boosted that to something more like 1,000.” Among these, about 200 were used by Dr. Xiaofeng Meng, a postdoctoral seismologist at University of Washington, as templates to detect more than 800 additional earthquakes with the node array. The depth and frequency of the earthquakes was surprising—the bulk were shallow, occurring at an average rate of four per hour during the two-week period, much more frequently than previously recorded. The reverse-time imaging results from Schmandt and Dr. Steve Hansen, a UNM postdoctoral seismologist, appeared in a recent issue of Geophysical Research Letters.
“The exact number of earthquakes is not so important,” says Schmandt, “but the big increase gives a chance to see whether the locations of earthquakes are steady or if they evolve over time.” Investigating where earthquakes occur gives insight into why they occur if we have good images of the subsurface structure. Analyzing a greater number of earthquakes increases the ability to accurately identify trends in where they occur.
Most earthquakes are created by slip on a fault, but this is not always the case at volcanoes, explains Schmandt. “We get a rather complicated set of different types of seismic signals that come from volcanoes,” he says. “A lot of them do look like fault-slip signals, but many of them don’t.” For example, movement of magma or opening and closing of cracks in the crust should produce signals that differ from earthquakes along faults, possibly explaining the complexity of earthquakes in volcanic fields.
Using the nodes, Margaret Glasgow, a graduate student at UNM, detected some unusual earthquakes that otherwise would have gone unnoticed. These start quiet and gradually become loud, have only low-frequency signals, and last longer than other earthquakes. Such long-period, low-frequency earthquakes have been observed in the past during times of volcanic activity, but in this study they were detected under Mount St. Helens during a quiescent period, and in some cases multiple times a day.
“This brings up the questions, ‘Are these happening all the time? Are these the same areas that would produce them later on in a more active phase?’” Schmandt hopes that continued monitoring, analysis, and imaging will help reveal connections between these unusual earthquakes and volcanic activity.
Under the Mountain
While enhanced monitoring of volcano-related earthquakes is helping to resolve the structure under the volcano and provide a link between the quakes and underground adjustments, to really characterize the structure beneath the volcano, Dr. Eric Kiser of University of Arizona and other iMUSH researchers are using seismic tomography. With this method, they create 2D and 3D images underneath Mount St. Helens from the surface to the crust–mantle boundary.
Called tomographic imaging, this approach measures seismic waves from two sources—a series of controlled small-scale explosions that generate seismic waves for the purpose of the imaging, otherwise known as active-source seismology, and waves from earthquakes or ambient noise in the earth, or passive-source seismology. The controlled explosions are set off in specially drilled wells, and can only be felt by humans on the surface within about 50 m of the site. The seismic waves refract and reflect in subsurface formations and are picked up by instruments on the surface. The resulting images show variations in the speed of seismic waves, allowing scientists to make inferences about properties of the materials that the waves passed through, such as temperature, composition, and presence of melt.
The iMUSH team set off 23 controlled explosions whose seismic waves were picked up by a temporary array of about 2500 instruments, including the 904 nodes. Hansen, the UNM postdoctoral seismologist, and others discovered a sharp transition in reflectivity at the Moho—where the earth’s mantle meets the crust—just beneath Mount St. Helens. They believe this is due to a shift in the composition of material in the uppermost mantle that is driven by dehydration of the subducting plate and changes in temperature suggesting that mantle melts originate east of Mount St. Helens. This matches up with recent imaging of the area by Kiser, who identified multiple magma reservoir beneath Mount St. Helens with seismic tomography. The upper-crust reservoir is directly beneath the volcano, but another potential reservoir southeast of the volcano lies at about 20-40 km deep, in the lower crust. A number of low-frequency earthquakes have occurred on the boundaries of the lower-crustal reservoir, which Kiser suspects may mark magma movement from this reservoir. His findings were published in a recent issue of Geology.
Moving Forward
iMUSH researchers have already produced a number of 2D images and are working on 3D images using both active and passive sources to create a comprehensive map of the area. The 3D images would enhance monitoring efforts and analysis of seismic activity at Mount St. Helens.
“We could put earthquakes in context,” says Schmandt. “We won’t just say that they happened somewhere near Mount St. Helens deep underground. If they’re right on the edge of a magma reservoir that we image, that’s something that we might want to pay attention to more than if they’re far from the magma plumbing system.”
The iMUSH project and the impressive but temporary increase in imaging power may also guide future monitoring practices. Instead of nine or 900 recording stations, Schmandt hopes to determine the optimal number and arrangement of instruments needed to adequately identify earthquake sources. “Is it just 25?” he asks. “Where would we put them? In what arrangement? What frequency range would they need to cover if we wanted to identify these strange low-frequency sources that might be related to fluid movement? These are the kinds of things we want to keep track of between volcanic events.”
Schmandt remarks that even if the network at Mount St. Helens remains unchanged moving forward, the 3D models emerging from the project will be a significant step forward, allowing scientists to put earthquakes in a much more refined structural context than previously.
The iMUSH seismology principal investigators include University of Washington’s Ken Creager, Heidi Houston, and John Vidale; Alan Levander of Rice University; Geoff Abers from Cornell University; Seth Mora of the U.S. Geological Survey Cascades Volcano Observatory; and University of New Mexico’s Brandon Schmandt.
NSF Funding Sources: EAR 1445937, EAR 1520875, EAR-1144455, EAR-1545750, EAR-1444275, EAR-1144568
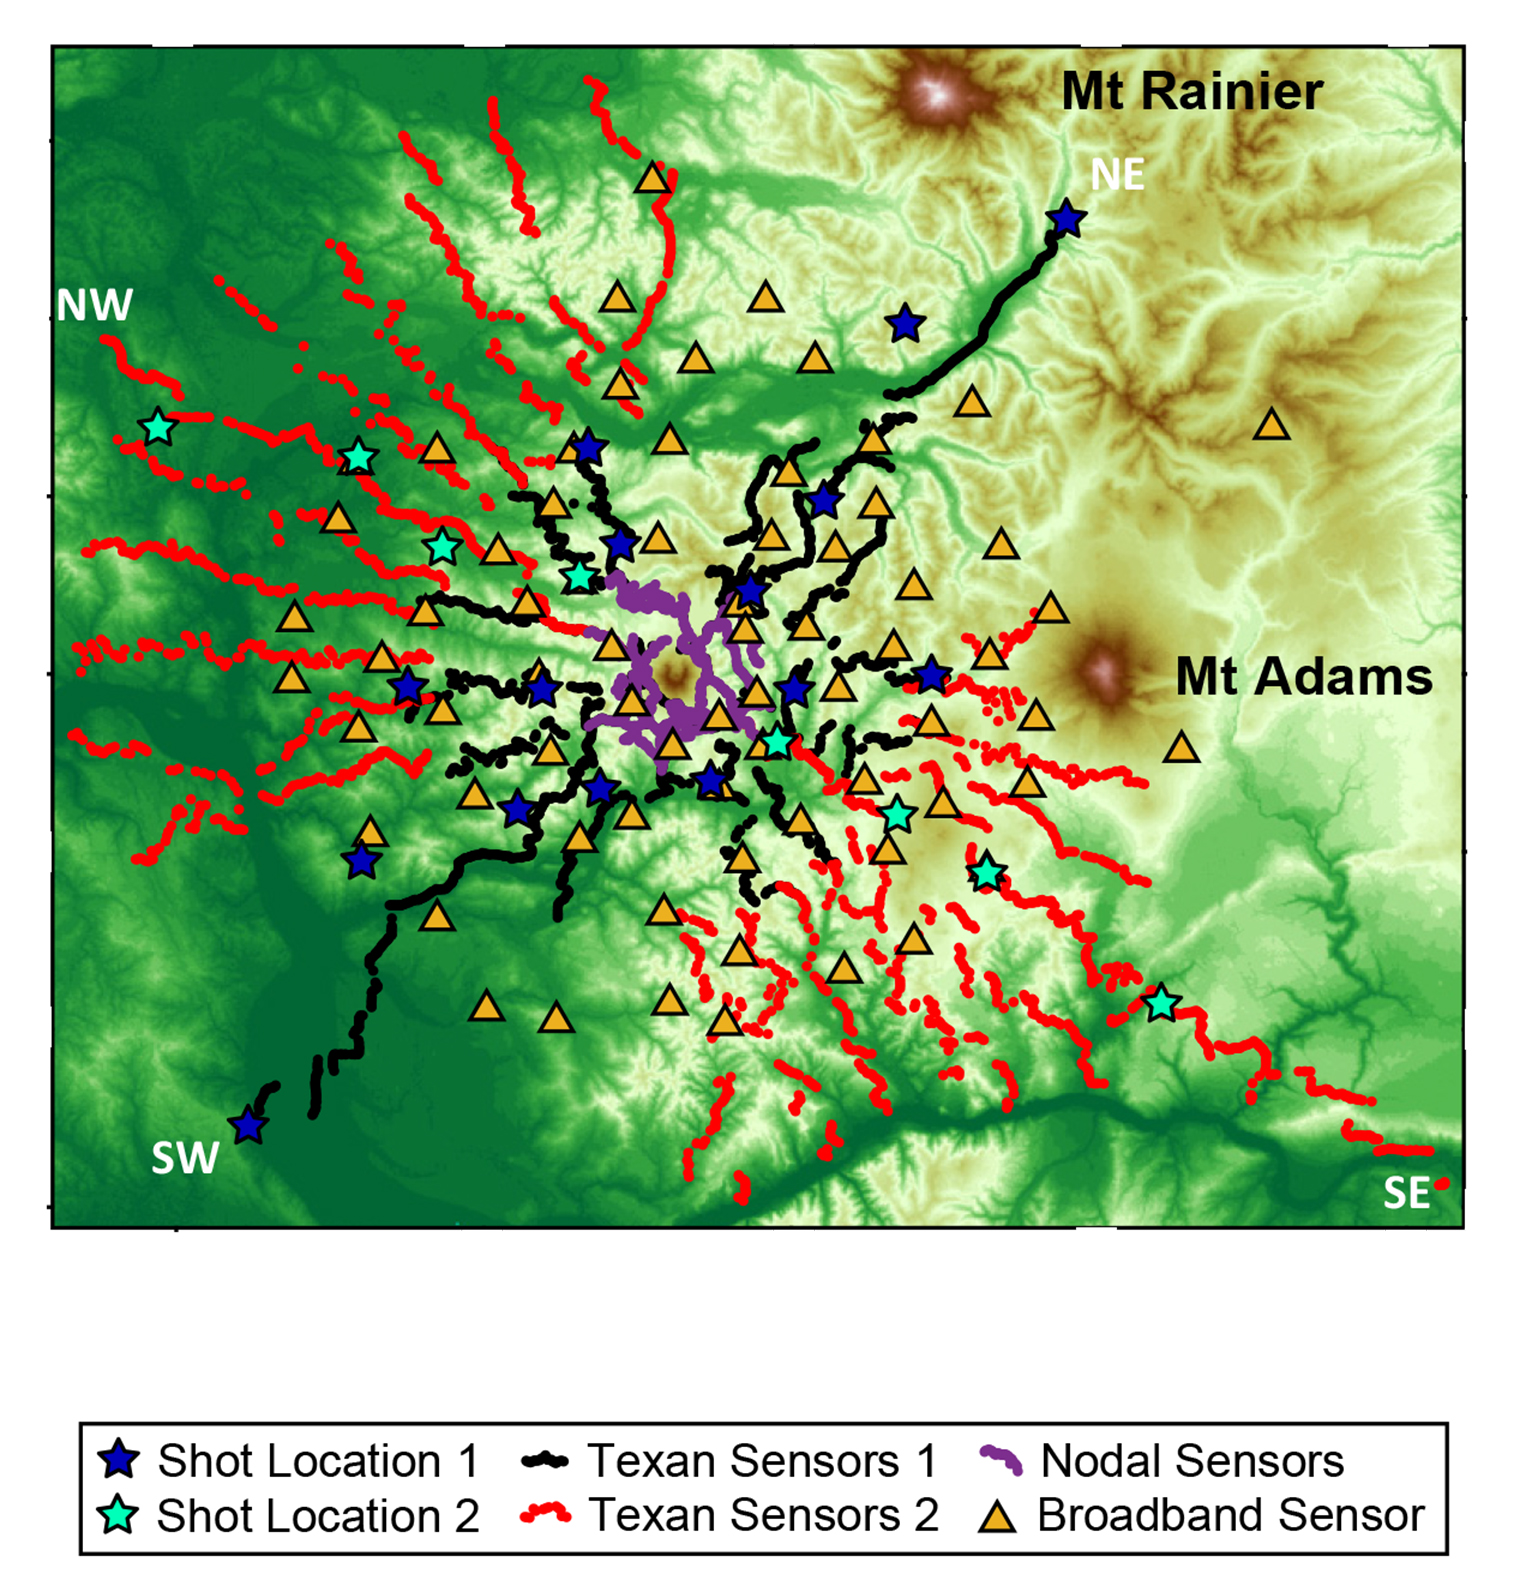
This shaded-relief map of Mount St. Helens and surrounding peaks shows how seismic instruments were arrayed across her flanks for the iMUSH experiment. The instruments include broadband seismographs, geophones with mini seismic recorders called “Texans” (deployed in two phases), and cable-free geophones, or nodes. The stars, labeled as shot locations, are the sites of the controlled, small-scale explosions.


