

By Kang Hyeun Ji - Fall 2013
Continuous monitoring of volcanic activity provides a way to detect changes from usual activity, provide warning impending eruptions, and reduce volcanic risk. We have developed a near real-time monitoring tool for surface deformation: Targeted Projection Operator (TPO). With the Global Positioning System (GPS) data from the Long Valley Caldera (LVC) in eastern California, TPO shows that LVC has experienced a sequence of deformation events including inflation from 2007-2009, slow deflation from 2009-2010, and a rapid inflation since late-2011. The current event is about four times faster than the 2007-2009 event and is ongoing, although starting June 2013 the rate began to slow. Here we briefly introduce how TPO works for continuous monitoring of deformation in LVC.
The TPO method assumes that an event has the same spatial pattern as previous deformation events but with different amplitudes. This assumption is reasonable for the recent relatively quiet phases in LVC because the spatial pattern of the 2007-2009 inflation is similar to that of the 2009-2010 deflation. Under this assumption, a known base pattern or "target" pattern is selected and the varying amplitudes are recovered by projecting the data along the target pattern. Large changes in amplitude imply changes in strength of the event. An anomalous change can be detected by comparing historic amplitudes. The technique is easily applied whenever new data are available. Ji et al. (2013) provides details of the technique.
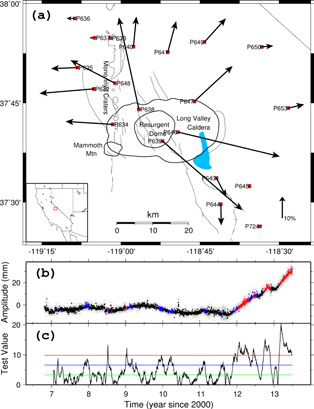
Operational use of TPO currently relies on GPS data from the EarthScope Plate Boundary Observatory stations around the LVC. The horizontal pattern of the 2009-2010 event was selected as a target pattern (Figure a). Then the horizontal components of the GPS data are projected along the target pattern to obtain the varying amplitudes or TPO time series (Figure b). The TPO time series shows that an inflation event began in late 2011 with brief pauses in during the summer and fall of 2012, continuing to the present time (July 2013). The inflation is consistent with a Mogi source located beneath the resurgent dome at about 6.6 km depth with an inflation rate of 0.009 km3/yr volume change.
To determine the anomalous amplitude of the TPO time series, we calculate differences between averages from two consecutive time windows (e.g., 60- and 30-day windows in the LVC case) and see if the differences are larger than the root-mean-square (RMS) error from relative quiescence. The recent inflation event is significantly large compared to relatively quiet periods (i.e., three times more than the RMS error, Figure c). In this way, TPO can be a useful tool for continuous monitoring, providing a timely alert of deformation events, and for assessing volcanic hazard in this potentially eruptive volcanic system.
References
Ji, K. H., T. A. Herring, and A. L. Llenos (2013), Near real-time monitoring of volcanic surface deformation from GPS measurements at Long Valley Caldera, California, Geophys. Res. Lett., 40, 1054–1058


