

Ground motion visualization for Mw 5.8 MONTANA earthquake

Watch how seismic waves travel away from an earthquake location in this animation that depicts the wave amplitudes at each seismometer location. The color of each symbol represents the amplitude of the vertical ground motion, as detected by the station’s seismometer.
The Montana GMV shown in the animation above is available at:http://ds.iris.edu/spud/gmv/13599211 — select “Vertical-component Expanded GMV”
To learn more and see other ground motion visualizations, please visit: https://www.iris.edu/hq/inclass/data-product/usarray_ground_motion_visualizations
GPS and Earthquake Early Warning
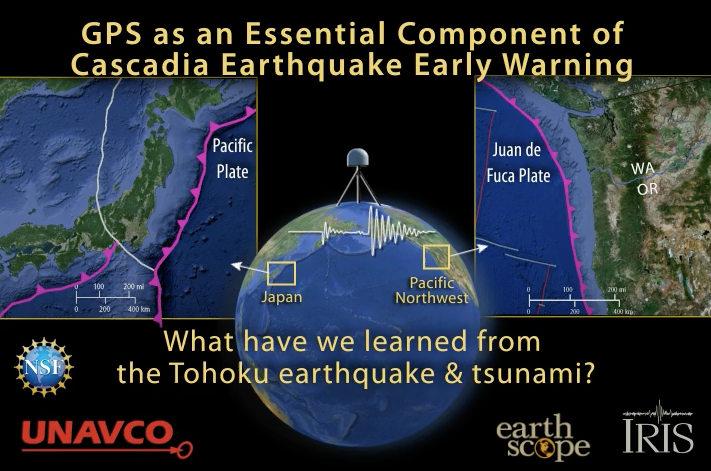
What makes for an effective earthquake early warning system? In this animation, we see why Japan's earthquake early warning system underestimated the magnitude of the March 11, 2011 Tōhoku event, leading to underestimates of the tsunami impact. The animation illustrates how GPS data can help scientists more effectively detect and describe a similar great earthquake along the Cascadia subduction zone in the western U.S.
Access the animation here: http://www.unavco.org/education/outreach/animations/GPSEarthquakeEarlyWarning.mp4


