
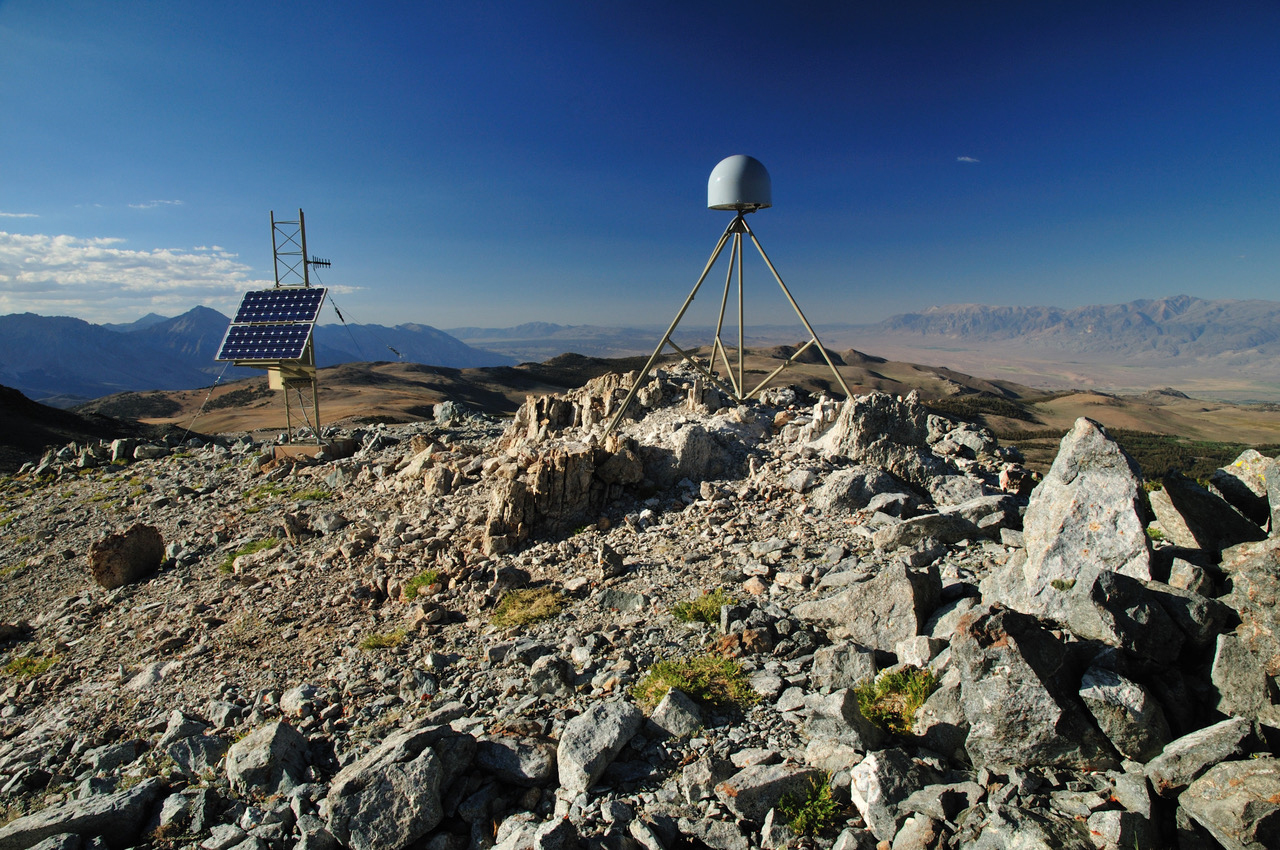
(Photo above: Geodetic GPS station P311 atop the Sierra Nevada mountains at Coyote Ridge, at an elevation of 3,699 meters, near Bishop, California. This station and many others show that these mountains are currently uplifting at 1–2 millimeters per year. Image courtesy of Shawn Lawrence, UNAVCO.)
by M. Meghan Miller, Beth Bartel, and Linda Rowan
Geodesy is the science of measuring the size, shape, and gravity field of Earth, and how these change with time. Over the last three decades, satellite positioning systems—such as GPS—have radically changed that field of science and how we make observations. EarthScope’s Plate Boundary Observatory (PBO), managed by UNAVCO, harnessed and furthered the capabilities of GPS and other geodetic instruments in a 1,200-station array across the western U.S. intended to better understand the tectonics of North America. This monumental project has advanced science and technology in ways unimagined 15 years ago when network installation began.
Unraveling the Details
In the early 1990s, prior to EarthScope, the geoscience community had begun to build ground surveying stations to collect information from the recently launched Global Positioning System (GPS). GPS is a constellation of U.S. satellites that, for the first time, made it possible to locate ground positions with unprecedented precision nearly anywhere on the surface of the earth in a global frame and in any weather. This was an enormous step forward from conventional surveying that relied on measuring the distance among points with a tripod-mounted laser or other conventional, ground-based instruments.
With enough GPS measurements, we now routinely locate any point within millimeters (with an uncertainty cloud about the size of a pinto bean) relative to a similar point (with its own similar uncertainty cloud) on the opposite side of the earth on a daily basis. The measurements are very useful for measuring tectonic plate motions, motions leading to earthquakes around active faults, the inflation and deflation of active volcanoes, and other Earth surface deformation. They are also very useful for discovering new things—such as the “slow earthquakes,” called episodic tremor and slip (ETS) events, that relieve stress on faults over weeks instead of minutes and simply could not be seen before.
Many of these discoveries, such as ETS, come from continuous measurements. Before EarthScope, many researchers were taking GPS to the field and setting up antennas over survey markers in the ground that could be observed for a handful of days, year after year, to measure motions as small as millimeters per year. But a week of measurements per year, even if it is every year, is nothing compared to measuring every day!
In the 1990s, the U.S. geoscience community began to develop permanent networks for continuous GPS observations. The Southern California Earthquake Center built the Southern California Integrated Geodetic Network to better understand earthquake potential, and also fault locking and breaking processes on the “overdue” section of the southern San Andreas fault. Regional networks in the Bay Area in California, Cascadia in the Pacific Northwest, Yellowstone, the Basin and Range region centered around Nevada and Utah, and Alaska followed suit focusing on other faults, volcanos, or studies of interest. It rapidly became obvious that much more was going on than we had ever been able to measure before, on long and short time scales.
EarthScope provided the umbrella to “federate” and dramatically densify these networks into the 1,100 GPS stations of the 1,200-station Plate Boundary Observatory. Once the networks were tied together, we could observe the North American plate–Pacific plate–Juan de Fuca plate (Cascadia) interaction in its entirety, as a system. Since the data were telemetered daily to UNAVCO’s central data repository and offered through free and open access, any researcher around the world could explore these data in near real time.
The Plate Boundary Observatory densified observations in both space and time. The stations sample not only at the standard rate of every 15 seconds, to be integrated into a daily position with very high precision, but also up to five times per second—which enables researchers to study short-term changes such as seismic waves passing through. High-rate data for more than 25 earthquakes have been captured since PBO was installed, including six earthquakes greater than magnitude 7. These data help researchers to understand both fast and slow processes leading up to, during, and after earthquakes from Alaska to California.
The addition of real-time data delivery after the network was installed furthered the capabilities and promise of PBO. The network now not only provides crucial reference stations for local surveyors but also improves the capabilities of earthquake and tsunami early warning systems, as well as flash flood and hurricane forecasting.
PBO is not limited to GPS. Under the guidance of the broad scientific community, UNAVCO also built a complementary network of borehole strainmeters that measure very small changes in the shape of a borehole up to 250 meters (750 feet) deep. The measured changes are very local, but the system can measure change that is only one millionth the width of a human hair. These measurements are much more sensitive than the GPS measurements, and can tell us quickly and precisely about any pressure changes along faults or around volcanoes, record seismic waves passing through, and measure earth tides. These strainmeters recorded the seismic waves from the 2011 Tohoku, Japan earthquake and the weight of the resulting tsunami on the west coast of the U.S.—from more than 50 miles from shore. The boreholes also house seismometers, which, because of their depth, provide valuable and “quiet” earthquake data, farther from the noise at the earth’s surface.
UNAVCO also coordinated collection of exquisitely detailed “bare Earth” topographic imagery along active fault traces and volcanic areas, using airborne lidar (laser) imaging. Lidar is able to “see” through vegetation, revealing fault paths hidden to other imaging methods. This imagery provides a baseline data set for the next earthquake that breaks the surface along these known traces, allowing for quantitative comparisons of before and after imagery in these fault zones. Many of these surveys are available for public exploration through kmz files for Google Earth.
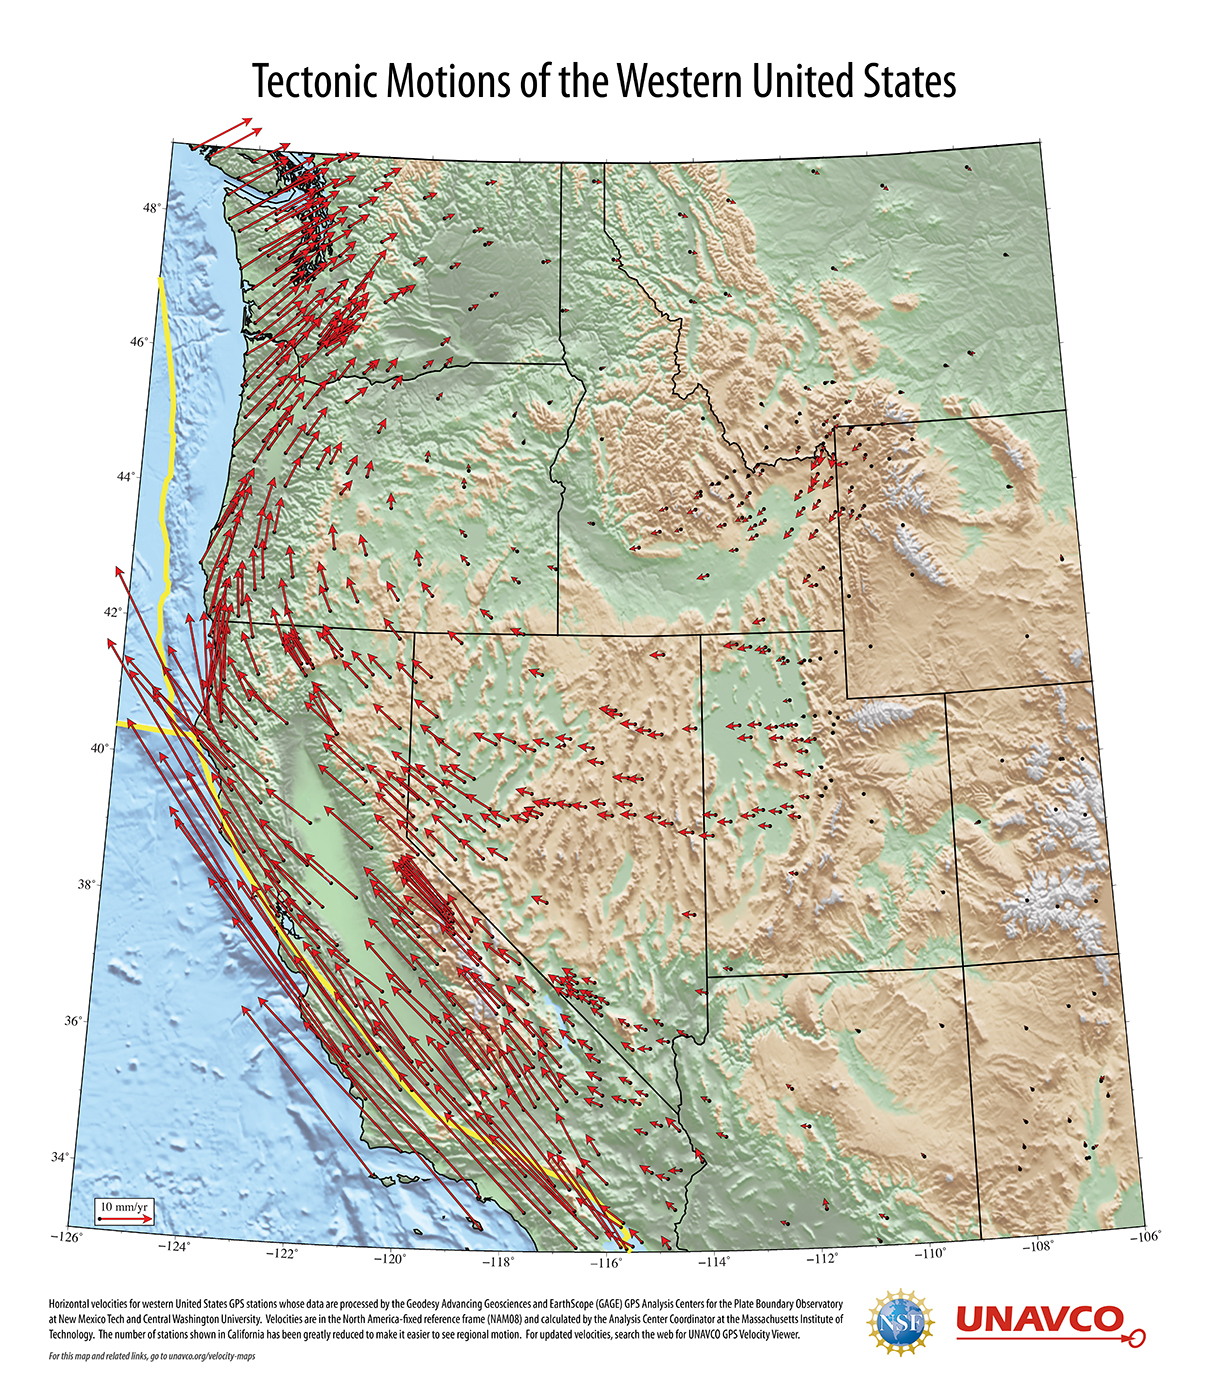
(Map: EarthScope Plate Boundary Observatory GPS stations have offered an unprecedented, comprehensive view of western U.S. tectonics. This poster captures only a sampling of the GPS stations throughout, in particular, California, and has been shared with tens of thousands of teachers throughout the country. A similar map shares station motions in Alaska. Both maps, like the data, are freely available online. Image courtesy of UNAVCO Education and Community Engagement.)
New and Unexpected Discoveries
All of these observations led to new discoveries. While the primary goal of the PBO network was to define tectonic motions throughout the western U.S., the density of data, both in space and time, yielded new insights—and new questions. Using long-term motions around faults, researchers were able to contribute updated and detailed geodetic models for the U.S. Geological Survey’s National Seismic Hazard Map Project. The scientists compared rates of motion along faults from modern GPS measurements and historical geological data, finding faults where the data agreed and others where the data did not. The work both improved hazards estimates and raised questions for further investigation.
Scientists already knew of the slow earthquakes (ETS events) mentioned earlier, but the data were scarce, and the discovery was fresh. With the dense data of PBO and complementary seismic networks, researchers have delved into the details of these “quiet” events that run along the subduction zone from British Columbia to northern California, studying the motion on scales from days to hours to weeks. Using strainmeter data, researchers observed that the fault slip moves a little slower or faster throughout the day depending on ocean tides. These ‘subevents’ represent one more factor that can help to determine why some parts of the plate boundary shift in slow slip events, not in large earthquakes.
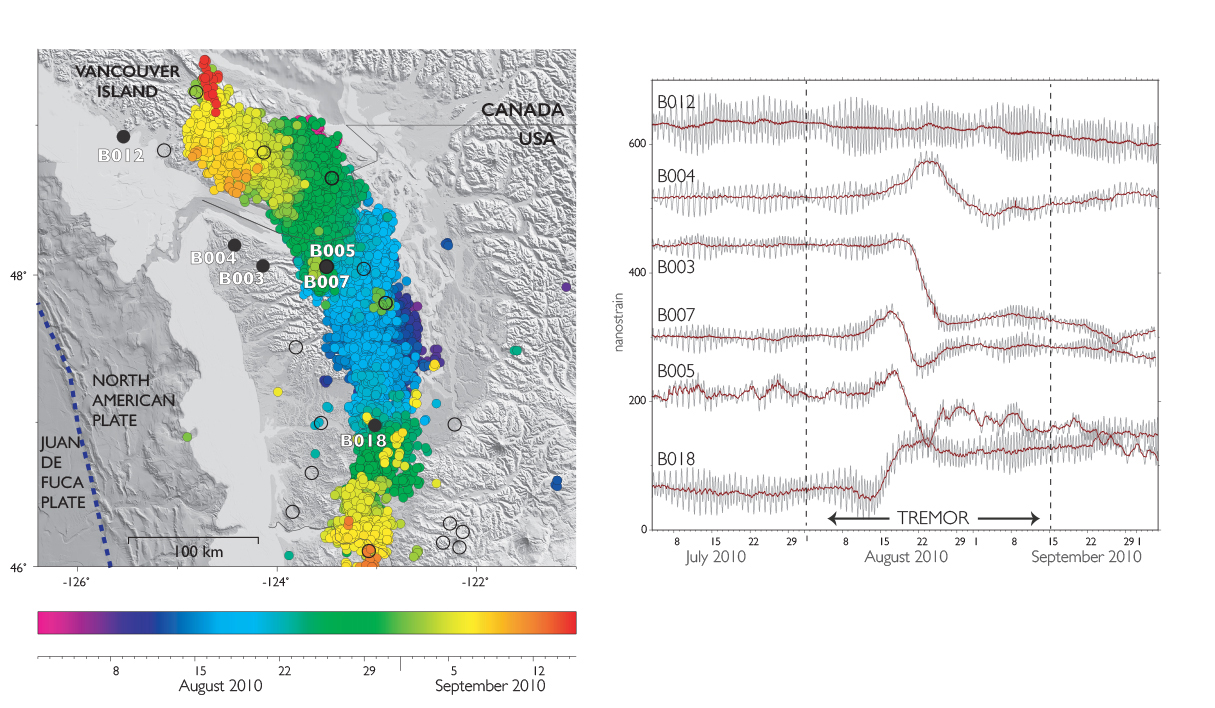
(Map: “Slow earthquakes,” or episodic tremor and slip (ETS), in the Pacific Northwest. Colored dots on the map on the left represent small, unfelt earthquakes (tremor), color-coded by time to show their propagation through the zone over the course of five weeks. Black dots show the locations of PBO borehole strainmeters. The earthquakes occur deep under the ground, at the subduction zone interface. On the right, the ETS event as recorded by the strainmeters. Each line belongs to a different strainmeter, and shows its tiny change in shape over time. Black lines include the daily shape changes from Earth tides and barometric effects. Red lines show the motion from the ETS event, with these other factors removed. Image courtesy of Kathleen Hodgkinson, UNAVCO.)
Tectonic motion is not the only motion that shows up in PBO sites. The solid Earth rises and falls in response to loading and unloading from changes in groundwater, surface water, soil moisture, snow, and ice. Closely examining annual variations in station heights, researchers found the Sierra Nevada of California rose during drought due to decreases in rain and snowfall, melting of glaciers and alpine snowfields, and shrinking of mountain lakes and reservoirs. Meanwhile, in the adjacent Central Valley, persistent groundwater withdrawal caused farmed valleys to sink. The researchers calculated the loss of water to be equivalent to a 10-centimeter thick layer of water over the analyzed area, or the annual amount of ice loss in Greenland. The GPS results provide greater spatial resolution than the Gravity Recovery and Climate Experiment (GRACE) satellite mission and thus provide enhanced information about water distribution for water resource management on a local to regional scale. This work gained wide attention from the popular press.
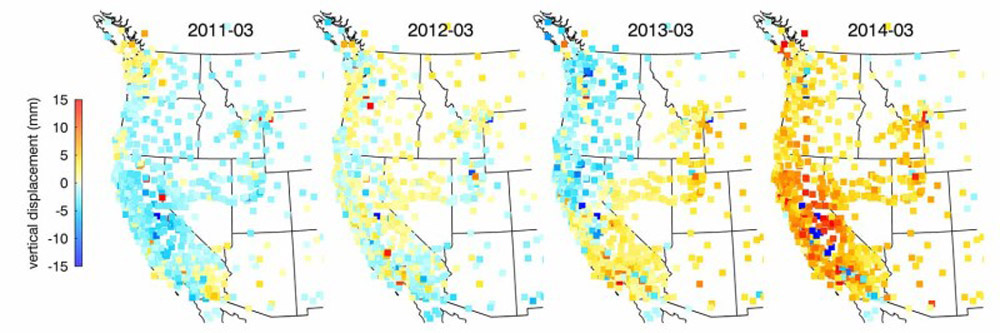
(Measurements of vertical motion of the surface at GPS/GNSS stations in the western U.S. The drought during this time period shows up most notably in California, as uplift (red and yellow) in the mountains and subsidence (blue) in the valleys. These motions were used to estimate the amount of water loss resulting from the dry conditions. Image courtesy of University of California, San Diego.)
Other researchers used this hydrologic information to examine rates of earthquakes along the faults in California, finding that a comparison of the earthquakes with the GPS data for seasonal water loading and unloading in California shows that small earthquakes can be triggered by the annual changes in the water cycle. This significant new result shows that unrecognized factors can affect the earthquake cycle in California. In particular, the seasonal and omnipresent water cycle can change the state of stress on faults. This work improves our understanding of earthquake processes and helps to inform the evolving earthquake forecast and earthquake early warning systems in California.
While the motion of GPS stations reveal processes both deep and shallow in the earth, the satellite signals themselves reveal still more. Before EarthScope, atmospheric scientists had recognized the utility of GPS in measuring our weather. Because the satellite signals travel through and are affected by Earth’s atmosphere, GPS can reveal factors such as precipitable water vapor (the amount of moisture in the atmosphere that can turn into rain). Researchers have used this information to improve hurricane forecasting. Data from PBO stations was also used to forecast flash flooding in California. More recently, during the tenure of EarthScope, researchers have discovered and refined methods for using GPS data to measure soil moisture, snow depth, water height, glacier height, and vegetation health, based on the way the satellite signals bounce off surfaces near the GPS antenna. This realization transformed PBO into an environmental monitoring network useful to climate scientists, ecologists, and the agricultural community alike.
The density and time scales of observations coupled with researchers’ innovative use of PBO data expanded the utility and potential of PBO well beyond what scientists envisioned in its planning phase several decades ago. Filling in the tectonic picture with long-term motions was critical on this massive scale. The more data that were collected, however, the more valuable scientists recognized these continuous data to be—the long-term motions of stations are punctuated not only by earthquakes, but also by slow slip, by the ups and downs related to water resources, and by phenomenon yet to be discovered. These “transient” motions tell us as much about the earth as the long-term trends do, if not more. Additionally, the utility of the network to surveyors and in early warning systems is far from fully realized. Over its short lifetime, PBO became a national asset.
The Future of the Plate Boundary Observatory
Over the course of the past 15 years, UNAVCO has worked with the National Science Foundation and others to stay on the forefront of advances in technology. Improved GPS receivers, data communication, data management software, and real-time capabilities have in turn improved the responsiveness of this vast network. UNAVCO continues to work to maintain the legacy of PBO, both the discoveries about our dynamic planet and also the tools we use to study it.
Fortunately, the Plate Boundary Observatory stations are continuing to provide data and new science breakthroughs beyond the life of the EarthScope program. The most critical observations will be sustained under a new project called the Network of the Americas (NOTA), which integrates the most essential stations from PBO and similar but sparser networks in Mexico and the Caribbean. These observations continue to be critical to growing understanding of the full range of fault and volcano systems in the western U.S., and the full range of time-varying deformation of the plate boundary systems. Lessons learned throughout this broad region inform our understanding of similar systems worldwide.
As time marches on and the face of our planet continues to change, we can only guess what this network and others like it will reveal. The EarthScope Plate Boundary Observatory established the infrastructure and trained a scientific community ready to explore the earth in new and unimagined ways. The 15 years of PBO data will continue to fuel discoveries as the records of motion extend into NOTA, evolving with technology and the minds of researchers yet to come.
For more science summaries or information on UNAVCO visit the website.


