
The EarthScope program, the most ambitious program within the National Science Foundation Earth Sciences division has funded, ran from 2003–2018. EarthScope examined the structure and development of the North American continent with unprecedented resolution, using three observatories composed of thousands of seismic, GPS, and other instruments in the field. EarthScope funded scientific investigations made use of those facilities and other data; supported education, public outreach, and engagement; and developed a cohesive, multi-disciplinary scientific community. All EarthScope data are available openly and immediately, and the large volume of high-quality open data transformed how scientists worked in a variety of disciplines.
Combining data from disparate disciplines and time scales yielded an unparalleled new view of our continent. Researchers exposed the collisions, break-ups, and twists of continental history to better understand how Earth’s distant past continues to affect and shape our current world. EarthScope data shed new light on active geological processes that lead to earthquakes and volcanic eruptions, helping researchers to understand what happens inside Earth and to better assess hazards. EarthScope drew the blueprint that international counterparts are currently using to build new earth science ventures on other continents.
To create the Top 10 Discoveries list, the EarthScope National Office asked EarthScope leaders, past and present, to submit several ideas each about what they considered to be the program’s top discoveries and science contributions. Current and former directors, steering committee members, synthesis workshop leaders, and longtime partners all listed ideas for the ballot. Scientists, students, and educators in the EarthScope community then voted for 10 items from the list and selected...
1. Background Noise Joins the Toolbelt of Seismology
Pioneered using ambient noise seismic wavefields for seismic imaging. Combined with other techniques, this provided unprecedented high-resolution images of the crust and upper mantle beneath North America, in which small-scale heterogeneities in the images correlate with geological features.
Why does it matter?
The coverage, density, and quality of EarthScope seismic data enabled the development of innovative new techniques to image geological structures below Earth's surface in unprecedented detail. One of the most transformative new methods uses seismic energy previously considered to be useless background “noise”—ambient seismic waves from sources such as ocean waves crashing into distant shoreline, wind, and even trucks or trains—to create high-resolution subsurface images. Previous methods used seismic waves from distant earthquakes to create images. By analyzing noise recorded on seismic stations adjacent to each other, it is possible to image the shallow earth structure between the stations in much greater detail than with earthquake waves. This important new technique is now routinely applied around the world and has sharpened our imaging and understanding of Earth structure, allowing us to learn more about how North America was assembled over geologic time.
2. Pacific Northwest Has a Slow Lane
Tracked slow-slip migration in the Cascadia subduction zone using seismic instruments and GPS stations, clarifying the picture of episodic tremor and slow slip in the region.
Why does it matter?
The Plate Boundary Observatory uses millimeter-accurate GPS instruments to measure the movement and collision of the Pacific and North American plates. The face-off creates a megathrust fault where one tectonic plate forces another down into the Earth, producing infrequent but enormous earthquakes. An unexpected discovery enabled by this observatory was that the plates gradually slide past each other for weeks at a time, moving much slower than earthquakes that happen when the plates lurch forward in just seconds. The combination of seismic and GPS instrument networks was critical for seeing that episodes of slow slip are accompanied by a nearly imperceptible ground movement called tremor that also lasts for weeks. It occurs along the bottom edge of the area that has historically produced large earthquakes, suggesting this newly discovered tremor and slow slip could be related to when and where bigger earthquakes occur. Detailed monitoring of the slow slips with EarthScope has provided a new way to investigate the possibility of dangerous earthquakes.
3. Open Data Opens Doors for Students
Provided unique education for a new generation of scientists by providing access to large, open data sets and data products.
Why does it matter?
EarthScope provided orders of magnitude more geophysical data than previously recorded because of the sheer number of instruments deployed for multiple years. EarthScope also successful tried and implemented something previously almost unheard of in the earth sciences—offering all data free for anyone to use. This inspired new data-storage methods and infrastructure, allowing researchers and students to securely access and archive vast amounts of data. Open data provided generations of scientists new avenues for cross-disciplinary work that continues to expand our knowledge of Earth, from hazards to structure and more.
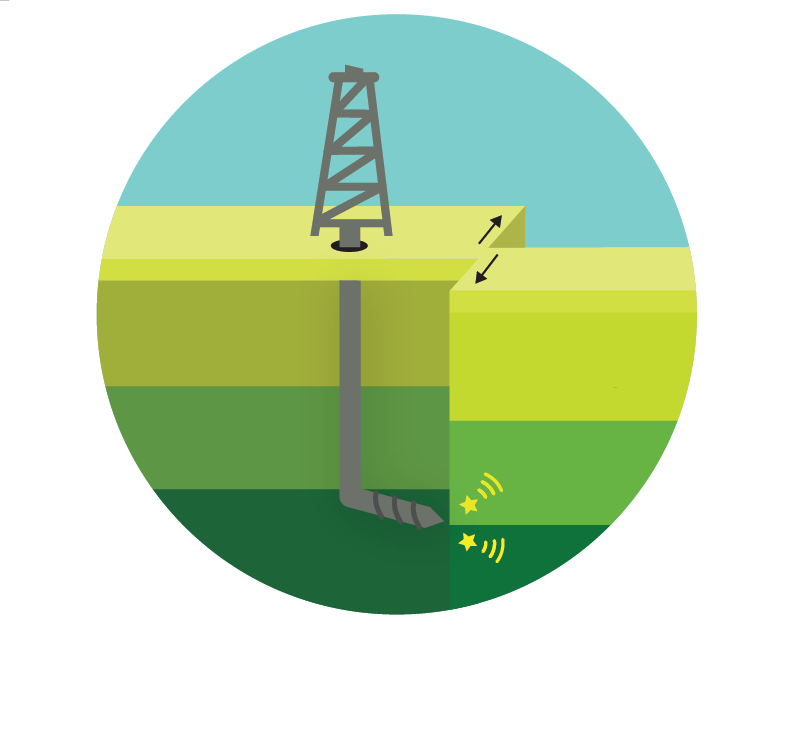
4. Why the San Andreas Fault Rocks
Discovered the internal structure and cause of weakness of the San Andreas Fault from the San Andreas Fault Observatory at Depth (SAFOD) rock core samples.
Why does it matter?
Studying a part of the San Andreas fault that creeps, or slips nearly continuously, provided some clues to understand why big earthquakes occur on some faults more often than others. The creeping section appeared to rarely have extremely large earthquakes, compared to other sections. Prior to drilling scientists had hypothesized that high fluid pressures along the fault made it weak. But SAFOD core samples of rocks from the actively deforming fault provided the first physical evidence that clay minerals make the fault weak here. Understanding how the composition of the San Andreas fault links to earthquake activity could help examine the behavior of other faults as well.
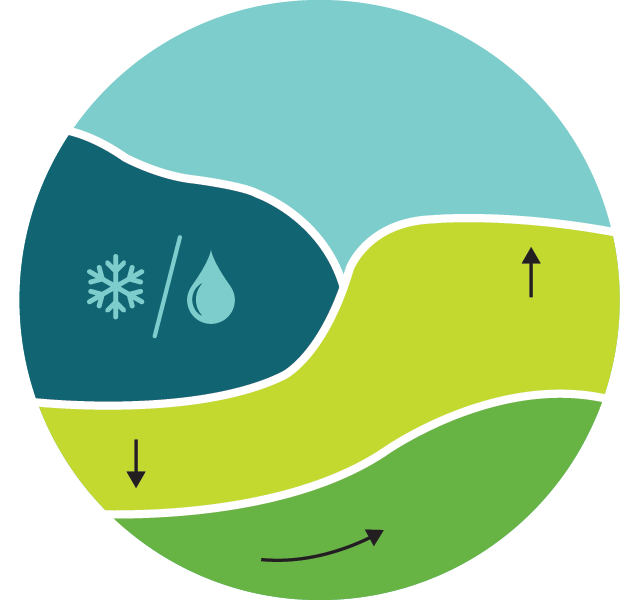
5. North America Is under Pressure
Demonstrated that the entire North American continent is deforming due to a combination of tectonics and changes in surface loads (water and ice).
Why does it matter?
EarthScope facilitated a dramatic increase in the density of GPS data across North America, resulting in a high-quality, continental-scale information and increased confidence in interpreting vertical ground motion. Major results include the recognition that glacial isostatic rebound—ground rising when the weight of glaciers melts away—affects the whole country. Another remarkable outcome is the ability to discern small, transient, vertical ground motions resulting from changing water loads due to droughts and storms. Because of this, we can now “weigh” the surface and ground water on the continent much better than ever before, and monitor changes in water resources.
6. Tracking North America’s Hidden Past
Imaged new slabs of the ancient Farallon plate and its predecessors, following the trail in the mantle of the plate breaking up under North America, showing it extends from the Pacific Coast subduction zone to deep below the eastern part of the continent.
Why does it matter?
The seismic data collected by USArray provided CAT-scan-type images of the deep earth beneath North America. These images illuminated in unprecedented detail previously unknown pieces of ancient, subducted tectonic plates extending from the surface in the Pacific Northwest to thousands of kilometers below the Atlantic coast. The discovery provided new insight into the origin of surface features such as the Colorado Plateau and the Yellowstone Hotspot, and may explain earthquake activity in the middle of the continent such as the New Madrid seismic zone in the southern Midwest.

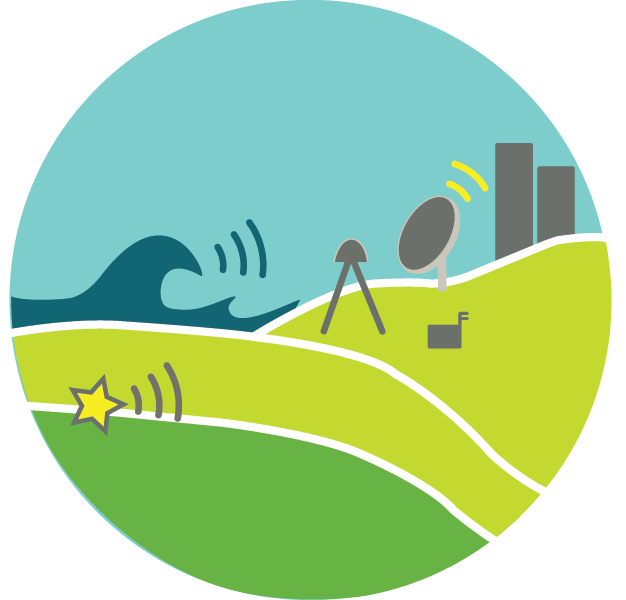
7. GPS Warnings
Learned GPS stations could provide effective early hazard warnings: station movements can be used to estimate earthquake magnitude in real time, similar to seismometers, to provide immediate alerts; and GPS signals can track a tsunami as the wave compresses the atmosphere above it, allowing time for an alert.
Why does it matter?
The biggest earthquakes can cause damaging shaking over large areas and produce devastating tsunamis. This makes accurate assessments of earthquake magnitude and dimensions critical for issuing warnings. Records of ground shaking and motion from GPS can estimate earthquake magnitude without the instrument being overwhelmed at large magnitudes. New techniques using GPS data can now complement records from seismometers, giving improved real-time estimates of magnitude, and making for more reliable tsunami warnings. Tracking tsunamis by using GPS data to measure disturbances in the ionosphere (upper layer of the atmosphere) will also provide more accurate assessments of tsunami arrival times, and more reliable warnings to the public.
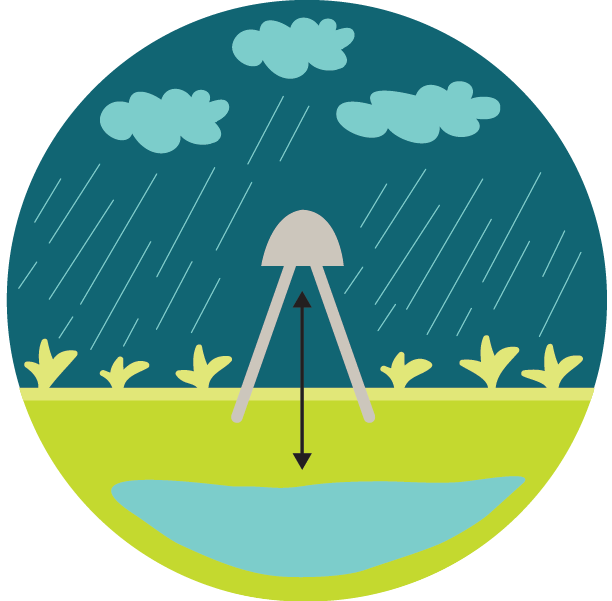
8. The Ups and Downs of Drought
Discovered methods of using GPS to detect changes in groundwater from observed vertical crustal movements in the shallow subsurface.
Why does it matter?
High-density GPS networks in California record ground-surface subsidence due to depletion of groundwater reserves related to extraction by humans, seasonal variations, and multiple-year changes such as drought. The implications of this work are important because 1) water and better knowledge of water resources is essential to human communities and ecosystems;and 2) flexure of the crust due to changing water loads can also bring the San Andreas fault or other faults closer to failure.
9. Backtracking to Global Breakups
Developed and applied high-resolution seismic source back-projection for imaging the
rupture dynamics of large global earthquakes.
Why does it matter?
Earthquakes are generated by fast movement of faults in Earth's crust. To understand the generation of earthquakes and hazards associated with them, it is essential to determine where fault movement starts and how it changes throughout the earthquake. Recordings of large earthquakes—the 2010 magnitude 8.8 Chile earthquake, for example—on the dense array of EarthScope seismometers made it possible to determine how much seismic energy radiated from different parts of a fault with time. From this comes reconstruction of fault movement during the earthquake. Scientists have made important discoveries about why earthquakes start and stop where they do, why large fault movements happen near the seafloor (generating tsunamis), and more.
10. Laser Vision to See Earthquake Damage
Pioneered before-and-after LIDAR techniques to measure earthquake displacements from the damaging magnitude 7.2 El Mayor-Cucapah earthquake in Mexico.
Why does it matter?
The pattern of slip along the fault plane during an earthquake is important to know, but hard to measure. LIDAR (laser-measured) maps of surface topography created before and after the El Mayor-Cucapah earthquake in Mexico were used to make a complete spatial map of the earthquake displacements at the surface. These displacements revealed new details of the fault motions at depth. Study of the pattern of fault movements provided critical details about the complex fault geometry beneath the surface, as well as how the earthquake rupture proceeded. In places where LiDAR maps exist before an earthquake, this technique could be used to help assess repairs in communities after earthquakes.

You can keep, or print a PDF of EarthScope Top 10 Discoveries here.


