
Researchers: Roland Burgmann, Taka'aki Taira, and Robert M. Nadeau (Berkeley Seismological Laboratory, University of California, Berkeley)
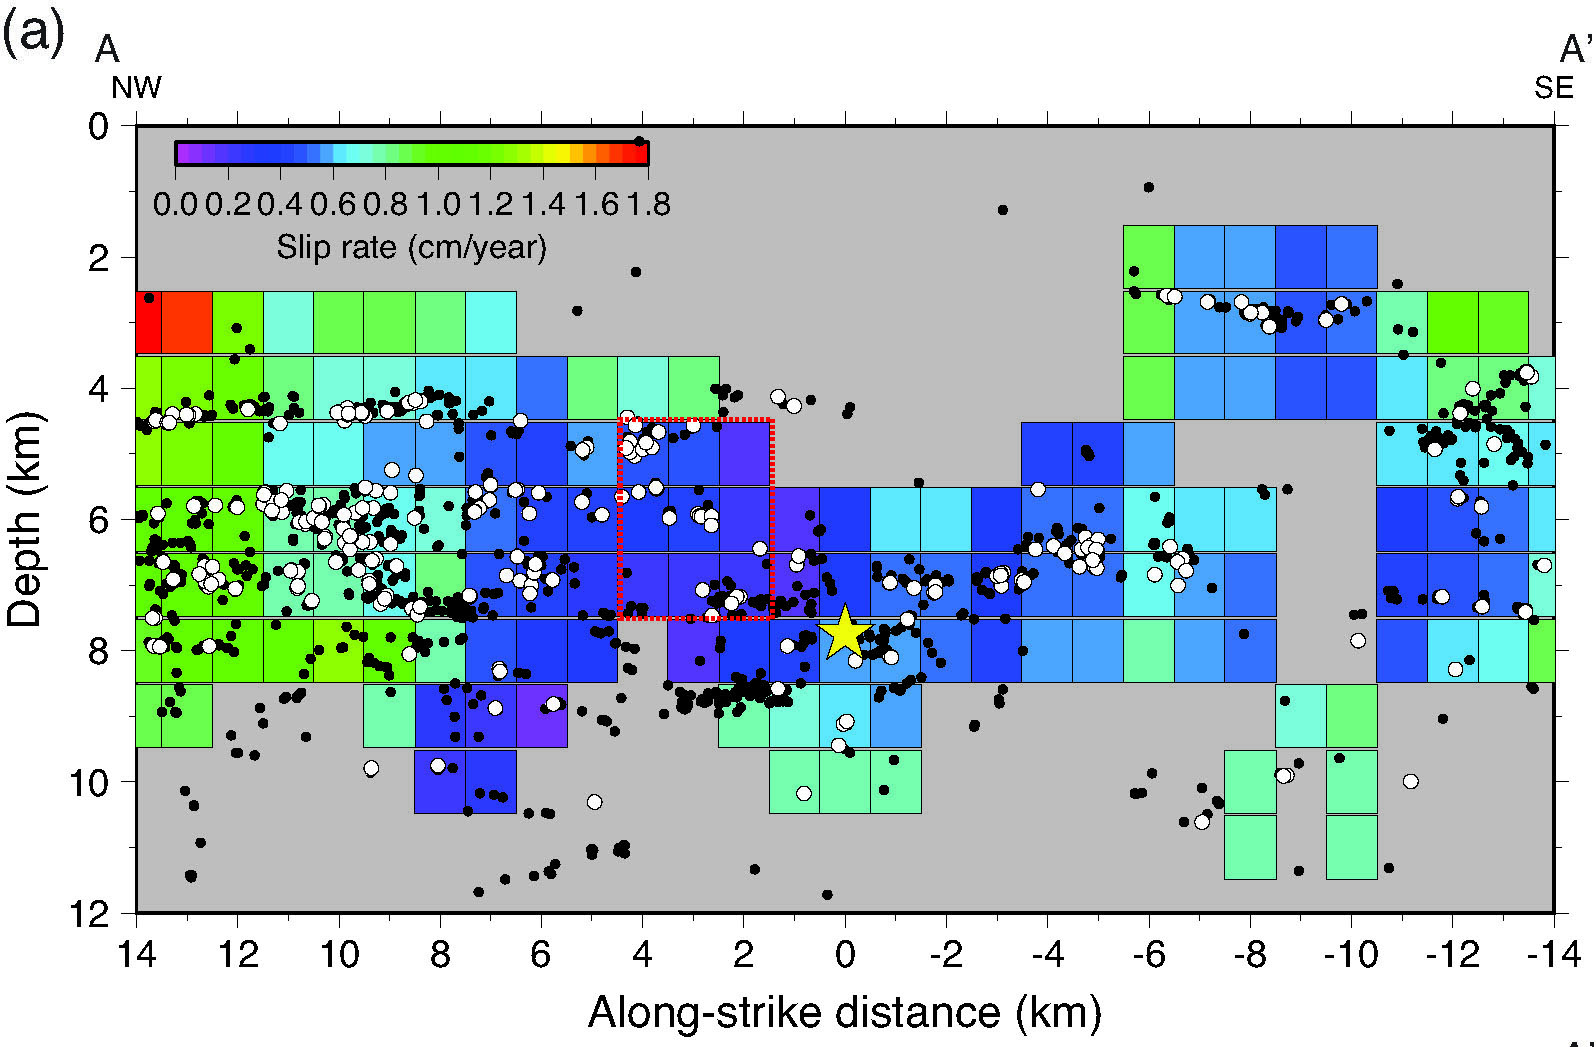
Figure above: Spatial variation in slip rate during 1984-1998 inferred from characteristically repeating microearthquakes. The 1989 Loma Prieta earthquake led to a long-term acceleration of fault slip. The yellow star is the 1998 Mw 5.1 SJB earthquake.
The temporal behavior of aseismic slip at depth can be inferred from characteristically repeating earthquake (CRE) activity. We examined spatial and temporal variations in fault slip near the 1998 Mw 5.1 earthquake that is the largest instrumentally observed earthquake in the San Juan Bautista area. Our analysis finds a 15-km-long partially locked section located near the 1998 earthquake rupture (Figure 1). The partially locked section could be capable of producing a Mw 6.22 earthquake every century, and such a large San Andreas fault rupture may have occurred in 1840 (M ~ 6.5) or 1841 (M ~ 6.0). Alternatively, multiple smaller earthquakes and transient aseismic slip may relieve much of the accumulating slip deficit. Substantial postseismic slip is observed through the repeating micro-earthquake activity and lasted for more than 1 year. The distribution of the postseismic slip shows an asymmetric pattern in which the postseismic slip expanded primarily to the northwest with a maximum slip of 9 cm occurring at a depth of 8 km (Figure 2). The large and asymmetric extent of the postseismic slip suggests a slow slip event triggered by the 1998 earthquake, rather than just afterslip relieving the static stress increase near the coseismic rupture. The moment of the triggered aseismic slip is equivalent to an Mw 5.22, which is a minimum estimate as additional creep likely occurred on sections of the fault lacking repeating earthquakes.
Figure 1: Spatial variation in slip rate during 1984-1998 inferred from characteristically repeating microearthquakes. The 1989 Loma Prieta earthquake led to a long-term acceleration of fault slip. The yellow star is the 1998 Mw 5.1 SJB earthquake.
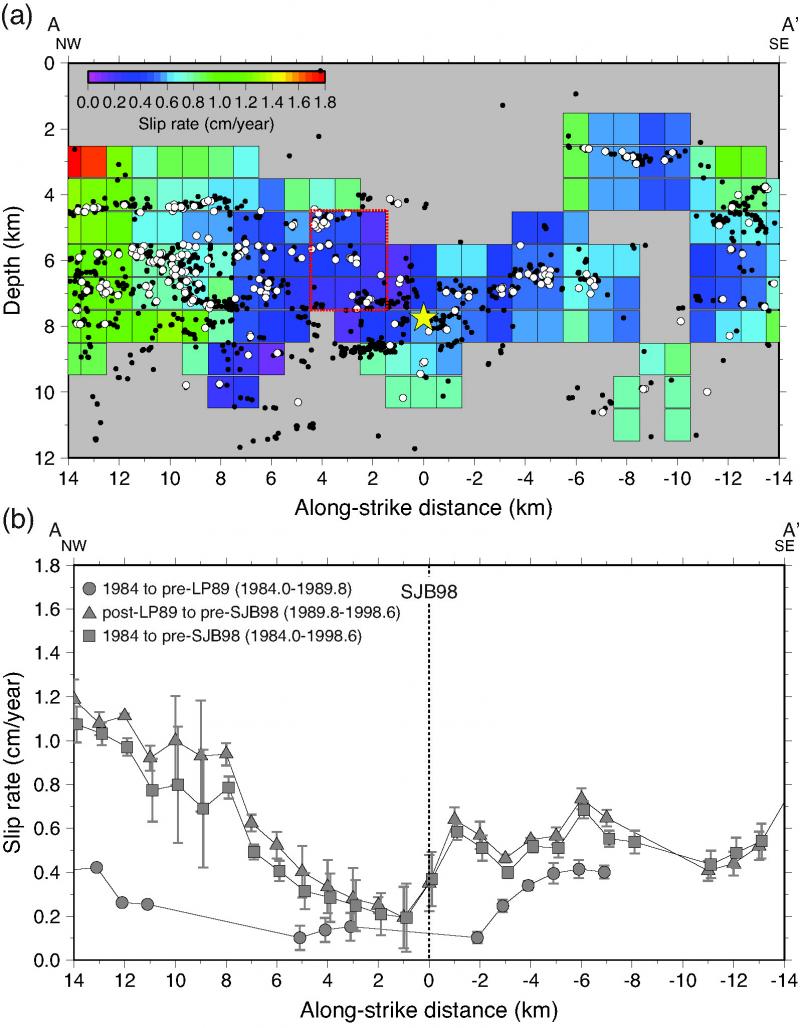
Figure 2: Spatial variation in cumulative postseismic slip of the 1998 Mw 5.1 SJB earthquake, inferred from characteristically repeating micro-earthquakes spanning the first 800 days after the event.
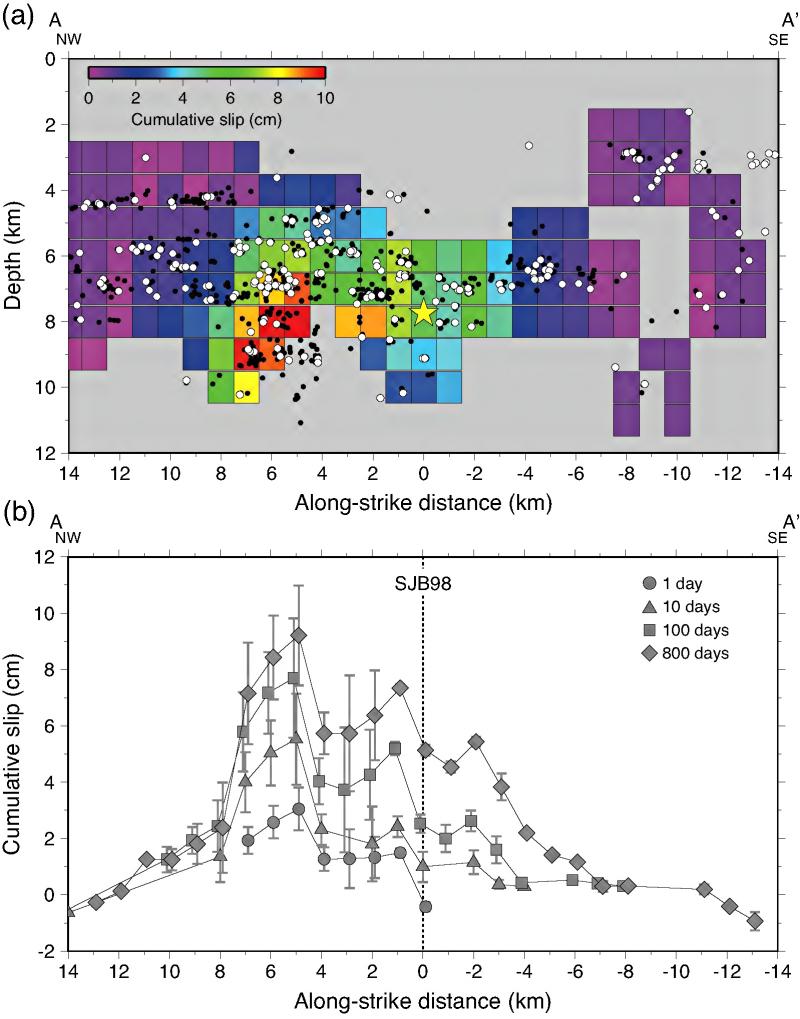
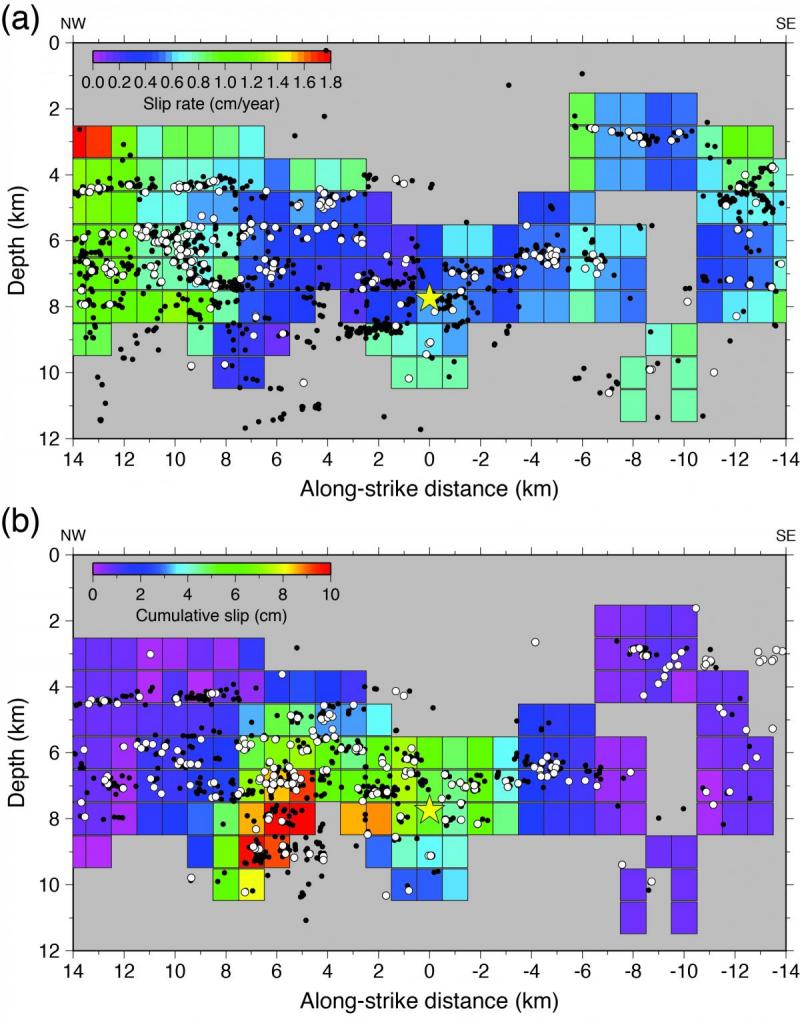
Figure 3: Fault slip estimation from the characteristically repeating microearthquake activity. (a) Spatial variation in slip rate during 1984-1998 and (b) spatial variation in cumulative postseismic slip in the first 800-day postseismic period following the 1998 Mw 5.1 San Juan Bautista (SJB) earthquake. White and black circles indicate repeating and background earthquakes, respectively. The yellow star is the 1998 Mw 5.1 SJB earthquake.
NSF Award: EAR 0951430
Duration of Project: 2010 to 2015
EarthScope Instruments/Facilities: Plate Boundary Observatory/GPS
Location Keywords: San Juan Bautista, California
References
Turner, R. (2014), Exploration of Slip Rate Variation on the Central San Andreas Fault Using Repeating Earthquakes and Geodesy 114 pp., M.Sc. Thesis, University of California, Berkeley, CA.


