By Terrence J. Blackburn, Samuel A Bowring, Scott Burdick, Robert van der Hilst, Kevin Mahan, Francis Dudas, and Katherine R. Barnhart - Spring 2010
As the USArray Transportable Array marches eastward, seismic images are providing ever more detailed insight into present day structures of the crust and mantle beneath North America. But how old are these structures and what do they tell us about the geologic history? Precise age constraints are needed for EarthScope to achieve its goal of producing a 4-D (i.e. time-dependent 3-D) picture of the continental evolution.

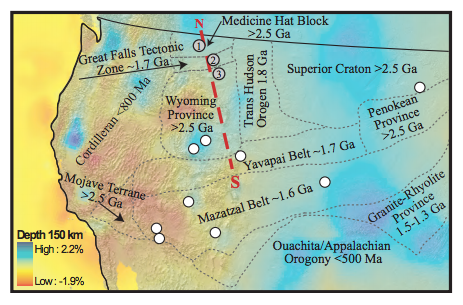
In some geological settings, thermochronology can establish the age of formation and the subsequent thermal history of structures revealed by seismic tomography. In Montana, for example, portions of two Archean cratons, the Medicine Hat Block (MHB) and the Wyoming Province (WP), are underlain by lithospheric mantle with higher than average wavespeeds (Figure 1), traditionally interpreted as cold and mechanically rigid lithosphere. With U-Pb thermochronology of lower crustal xenoliths that erupted ca. 50 Ma, we can “date” tomographically inferred features and determine the region’s thermal history.
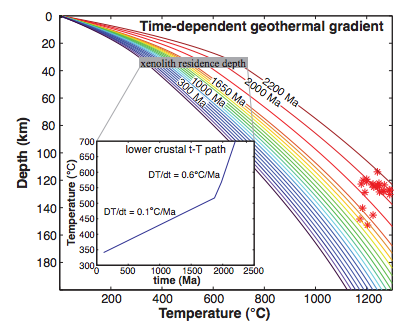
Thermochronologic techniques, including U-Pb, 40Ar/39Ar, and (U-Th)/He systems, allow scientists to constrain the time-temperature (t-T) evolution of rocks. The temperature-dependent diffusive loss of daughter isotopes in the systems can be quantified by volume-diffusion theory to yield reliable, temperature-sensitive dates. The relatively slow diffusive transport of Pb allows U-Pb thermochronology to quantify cooling rates as rocks pass through moderate to high thermal windows (400-700°C) representing cooling histories at 20-50 km depth. At these depths the lower crust contains accessory minerals such as rutile (TiO2 ) and titanite (CaTiSiO5 ), which are amenable to U-Pb dating. Constraints on sample residence depth are derived from geobarometric and sample wavespeed measurements. Lower crustal xenoliths yield thermal histories over tens to hundreds of degrees over hundreds of millions of years. This protracted slow cooling indicates a thick cratonic keel that insulates the deep crust from mantle heating and a crustal cover that insulates the lower crust from rapid cooling. Thermal model calculations that include the xenolith thermal history and residence depth place constraints on the thermal history of the underlying lithosphere (Figure 2). Because seismic velocity of mantle lithosphere is intimately linked to composition and temperature, the age of these anomalies may be best constrained by combining traditional mantle xenolith studies with lower crustal thermochronology.

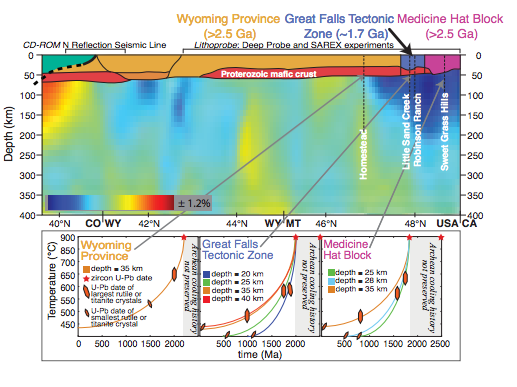
Outcrops and potential field data delineate the two Archean terranes, the MHB and the WP. An ENE-WSW trending gravity anomaly between the terranes, the Great Falls Tectonic Zone (GFTZ), is interpreted as a suture. Zircon U-Pb geochronology of lower crustal xenoliths reveals a punctuated high-temperature history beginning with craton formation ~2.5-2.7 Ga followed by pervasive magmatic events between ~2.2 and ~1.7 Ga, the later time being consistent with GFTZ formation. U-Pb thermochronology shows no Archean cooling history but instead yields only Proterozoic and younger dates that span up to 800 Ma for a single sample. The youngest measured date in each range corresponds to the smallest rutile crystals from the xenolith; the oldest date corresponds to the largest crystals, consistent with the length-scale dependence of diffusion. The large time span indicates prolonged cooling through the Partial Retention Zone (PRZ), a region in t-T space where Pb is partially open to diffusive loss. In general, the slower the lithosphere cools, the longer a mineral phase will reside in the PRZ, resulting in a larger range of radiometric dates between the smallest and largest crystals.

The thermal histories across strike of the orogen are surprisingly uniform (Figure 3). Depending on sample residence depth, lower crustal samples from the Archean and Proterozoic domains record prolonged cooling beginning immediately following collision, ~1.8 Ga, until ~50 Ma when samples were quenched during eruption. The fast seismic anomaly beneath the Archean MHB and WP could, based on upper crust and mantle geochronology, be interpreted as entirely Archean in origin. Lower crustal xenoliths, however, reveal that at 30-50 km depth, the region was heated to 800°C or more during Proterozoic collision. Extrapolating temperatures downward (Figure 2) implies far higher temperatures in the lithospheric mantle and raises the possibility of thermal reactivation and modification by addition of asthenospheric melts. This thermal event was followed by long, slow cooling, suggesting the fast seismic anomalies often associated with stable cratonic regions were not formed until after the Proterozoic collision.
A high-resolution thermochronologic record from the lower crust provides new constraints on the time scales required for the lithosphere to attain the low geothermal gradients measured in cratonic settings today. The near-continuous temperature-time record provided by the lower crustal xenoliths allows us to unravel the tectonic history of cratons, thus connecting the ancient history of lithosphere formation provided by geochronology with observations of the present-day lithosphere produced by geophysics.


