
Science Nugget - By Bridget Smith-Konter (University of Hawaii at Manoa), David Sandwell (Scripps Institution of Oceanography), Xiaopeng Tong (University of Washington), Samuel Howell (University of Hawaii at Manoa), Neil Frazer (University of Hawaii at Manoa) - NSF # EAR 1147427/1424374 | 2012-2016
The San Andreas Fault System, one of the best-studied transform plate boundaries on Earth, is well known for its complex network of locked faults that slowly deform the regional crust in response to large-scale plate motion. Horizontal interseismic motions of the fault system are largely predictable, but vertical motions arising from tectonic sources remain enigmatic. Dense Global Positioning System vertical velocity data in southern California should theoretically observe vertical velocity fluctuations from earthquake cycle loading. However, this signal is often masked by velocity variations across small distances (<10s km) in both magnitude and direction induced by non-tectonic signals. Here we show that when carefully treated for spatial consistency, GPS-derived vertical velocities expose a small amplitude (±2.5 mm/yr), but spatially considerable (200 km), coherent pattern of uplift and subsidence straddling the San Andreas Fault System in southern California. This vertical velocity field shows remarkable agreement with the sense of vertical motions predicted by physical earthquake cycle loading models spanning the last few centuries. This study reveals the subtle but identifiable tectonic fingerprint of far-field flexure due to 300+ years of fault-locking and creeping depth variability along the fault system. Understanding this critical component of interseismic tectonic deformation at a complex strike-slip plate boundary has important implications for quantifying seismic hazards in Southern California and beyond.
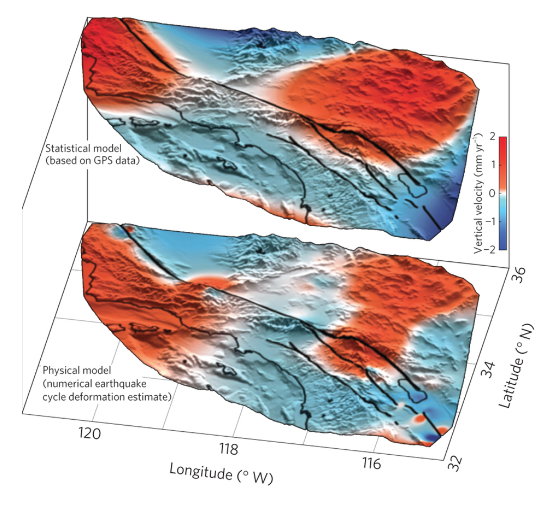
Top Figure: Vertical velocities predicted by model selection (statistical, s-model) using GPS data and the best-fitting physical deformation model (p- model) simulating the vertical crustal response of earthquake cycle loading at depth throughout the past 300 or more years. The p-model velocity estimate represents regional vertical motion due to the interaction of creeping and locked faults embedded within a 50-km-thick elastic plate overlaying an asthenosphere with a viscosity of 1 ×10¹⁹ Pa s. Vertical velocity estimates overlaying shaded topographic relief are saturated near ±1.5 mm yr−1 to highlight agreement in the sense of motion between data and model predictions.
References
Howell, S., B. Smith-Konter, N. Frazer, X. Tong, and D.T. Sandwell (2016), The vertical fingerprint of earthquake-cycle loading in Southern California, Nature Geosciences, doi: 10.1093/2015-03- 04591.
Tong, X., D.T. Sandwell, and B. Smith-Konter (2015), An integral method to estimate the moment accumulation rate on the Creeping Section of the San Andreas Fault, Geophysical Journal International, doi: 10.1093/gji/gjis140783.
Smith-Konter, B., G.M. Thornton, and D.T. Sandwell (2014), Vertical crustal displacement due to interseismic deformation along the San Andreas fault: Constraints from tide gauges, Geophysical Research Letters, doi:10.1029/2014GL060091.
Tong, X., B. Smith-Konter, and D.T. Sandwell (2014), Is there a discrepancy between geological and geodetic slip rates along the San Andreas Fault System?, Journal of Geophysical Research, doi:10.1029/2013JB010765.


